
Most consumer brand founders can tell you their revenue. Far fewer can tell you whether that revenue is actually making them money. The gap between growing fast and growing profitably is where brands die, and the failure to build a profitability roadmap for your consumer brand is usually the root cause. This article walks you through the specific frameworks that separate brands that scale sustainably from those that run out of cash at exactly the wrong moment: cohort unit economics, marketing budget allocation, customer profitability analysis, and scenario modeling.
Table of Contents
- Key takeaways
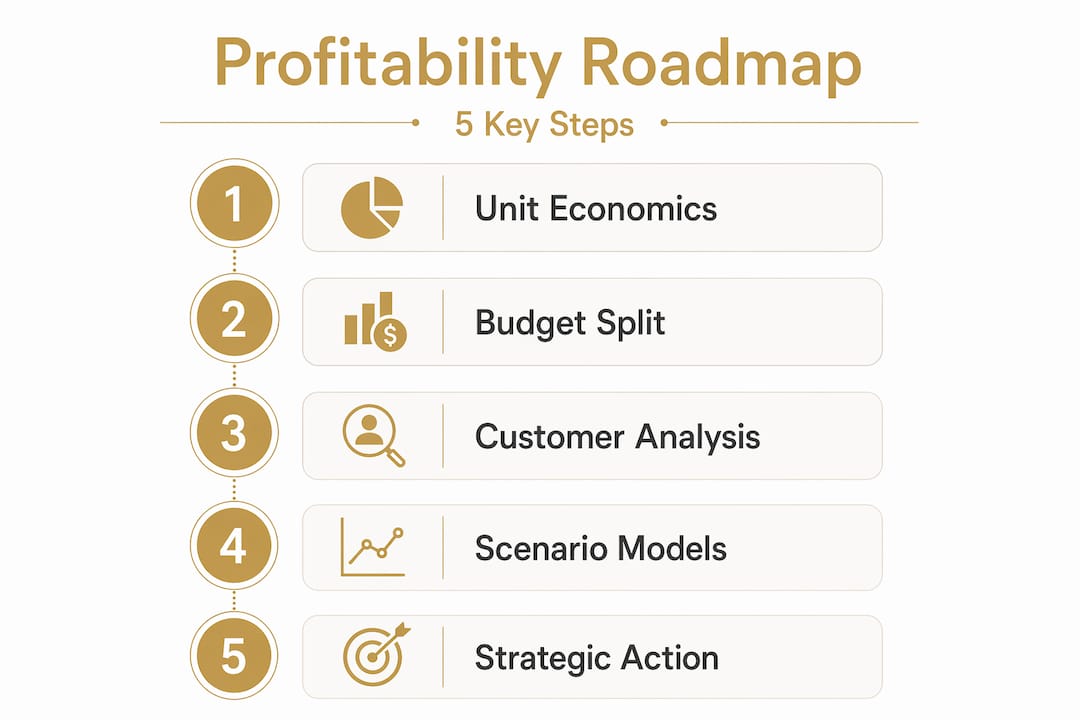
- Build your profitability roadmap on unit economics
- Allocating your marketing budget for sustainable profit
- Customer profitability analysis: find your best customers
- Scenario analysis: plan for what you cannot predict
- My honest take on what founders get wrong
- How Commerce Catalyst helps you build your roadmap
- FAQ
Key takeaways
| Point | Details |
|---|---|
| Start with unit economics | Know your LTV:CAC ratio and payback window before scaling any channel. |
| Balance brand and performance spend | A 60/40 brand-to-performance split lowers long-term CAC and sustains growth. |
| Segment customers by true profitability | Include cost-to-serve in your analysis, not just gross margin, to find your best customers. |
| Model multiple financial scenarios | Best, worst, and likely cases reveal cash risks that net margin views completely miss. |
| Integrate marketing with financial data | Connecting ad spend to cohort LTV is what separates brands that scale from those that stall. |
Build your profitability roadmap on unit economics
Every consumer brand growth plan worth executing starts in the same place: understanding exactly how much it costs to acquire a customer, how much that customer generates over time, and how long it takes to get your money back. These three numbers, your CAC, your LTV, and your payback window, are the foundation of any consumer brand financial roadmap.
The benchmark that matters most is the LTV:CAC ratio. A ratio of 3:1 or greater is the standard target for healthy consumer DTC brands. Drop below 2:1 and you are effectively burning cash to acquire customers who will never return enough value to justify the spend. Push above 4:1 and you may actually be under-investing in growth, leaving market share on the table.
Payback windows matter just as much. Under 90 days is acceptable. Under 60 days is genuinely strong. The reason this number is so critical is cash. A brand growing at 40% year-over-year with a 180-day payback window can find itself perpetually cash-constrained even while the P&L looks fine on paper.
The right way to calculate these metrics is through cohort analysis. Rather than averaging all customers together, you track groups of customers acquired in the same period and measure their cumulative contribution margin over time. Cumulative contribution margin must recover the CAC invested before you can claim a customer is profitable. Gross margin alone does not tell you this story.
Here is what to track for each monthly cohort over a 6 to 12 month window:
- First-order contribution margin: Revenue minus COGS minus variable fulfillment costs
- Repeat purchase rate by month: What percentage of the cohort buys again in months 2, 3, 6, and 12
- Cumulative CAC recovery point: The exact month when the cohort’s cumulative margin crosses the original acquisition cost
- LTV curve shape: Flat curves signal one-and-done buyers; steep early curves signal strong retention
Pro Tip: Use your unit economics calculator to model CAC, LTV, and payback before you increase ad spend on any channel. Scaling a channel with a broken payback window accelerates cash burn, not growth.
The most common mistake founders make here is waiting until they have “enough data” to run cohort analysis. Six months of real cohort data is enough to make directionally sound decisions. Start now with what you have.
Allocating your marketing budget for sustainable profit
Once your unit economics are clear, the next question is how to allocate your marketing budget in a way that protects profitability over both the short and long term. Most early-stage consumer brands over-index on performance marketing because it produces measurable, immediate results. The problem is that performance marketing has transient effects. The moment you stop spending, the sales stop.

The research on this is clear. The 60/40 brand-to-performance split maximizes combined short and long-term profit for consumer brands. Sixty percent of budget goes toward brand building: content, storytelling, community, and awareness. Forty percent goes toward sales activation: paid search, paid social, and promotions. Brand investment creates lasting awareness and trust, which reduces CAC over time. Performance spend converts that awareness into immediate revenue.
The table below shows how the split affects key metrics at different stages of brand maturity:
| Brand stage | Typical current split | Recommended shift | Expected impact |
|---|---|---|---|
| Early stage (0-2 years) | 20% brand / 80% performance | Move to 40/60 | Builds awareness foundation, reduces CAC in year 2 |
| Growth stage (2-5 years) | 30% brand / 70% performance | Move to 50/50 | Lowers blended CAC, improves retention |
| Mature stage (5+ years) | 40% brand / 60% performance | Move to 60/40 | Maximizes long-term profit, sustains market share |
Rebalancing does not happen overnight. Gradually shifting from performance-heavy to the 60/40 split is the practical approach. A brand moving from 20/80 to 60/40 in a single quarter will see a short-term revenue dip that can spook founders into reversing course. The right move is a 5 to 10 percentage point shift per quarter, monitored against brand awareness metrics, new customer acquisition rates, and blended CAC trends.
Pro Tip: Track brand spend effectiveness through aided awareness surveys, share of search, and new-to-brand purchase rates rather than last-click attribution. Performance metrics will always make brand spend look inefficient. That is the wrong lens.
A real-world example of brand investment paying off: Baileys’ seasonal launch recruited 70% new shoppers and delivered a 233% online sales uplift versus prior new product launches by prioritizing joyful brand experiences and trust-building through reviews. That result does not come from performance spend alone.
Customer profitability analysis: find your best customers
Revenue is not profit. This sounds obvious, but most consumer brands manage their customer base as if all revenue is equally valuable. Customer profitability analysis, or CPA, fixes that by measuring the true profit generated by each customer segment after accounting for every cost associated with serving them.
CPA measures revenue minus all costs per customer segment, including cost-to-serve items like customer support, returns processing, and logistics. This is what separates CPA from a simple gross margin calculation. A customer who buys frequently but returns 40% of orders and contacts support after every purchase may look profitable on gross margin. CPA reveals they are not.
Here is how to build a basic CPA model for your brand:
- Step 1 - Calculate net revenue per customer: Start with gross revenue and subtract returns, discounts, and chargebacks
- Step 2 - Subtract COGS: Apply your true product cost including inbound freight and landed cost
- Step 3 - Subtract variable fulfillment costs: Outbound shipping, packaging, and pick-and-pack fees per order
- Step 4 - Subtract cost-to-serve: Allocate customer support time, return processing costs, and any loyalty program costs
- Step 5 - Subtract allocated CAC: Divide your acquisition spend by cohort and assign it to the relevant customers
The result is a true profit-per-customer figure. Segment your customers into three tiers: highly profitable, marginally profitable, and unprofitable. Improperly allocated costs lead to misleading profitability rankings, so accuracy in steps 3 and 4 is what makes or breaks the analysis.
Once you have your tiers, the strategic decisions become obvious. Your top tier gets more marketing attention, personalized retention programs, and potentially premium service options. Your bottom tier gets pricing adjustments, reduced service investment, or a deliberate decision to stop acquiring customers who match that profile. This is how to increase brand profitability without simply spending more on acquisition.
For benchmarks specific to your category, the supplements and wellness brand benchmarks and food and beverage benchmarks published by Commerce Catalyst give you realistic CPA and margin targets to calibrate against.
Scenario analysis: plan for what you cannot predict
The most dangerous assumption in any consumer brand financial roadmap is that the future will resemble the past. Scenario analysis replaces that assumption with a structured process for modeling what actually happens to your profits when key variables move.
Traditional forecasting takes your historical growth rate and projects it forward. Scenario analysis instead identifies the 5 to 8 variables that most directly drive your profit, then builds three versions of the future: best case, worst case, and most likely case. Focusing on key profit-moving variables like unit sales volume, contribution margin, CAC, inventory turns, and cash cycle length can improve EBITDA margins by an average of 6.7 points in the first year of disciplined scenario planning.
For a consumer brand, the key variables typically include:
- CAC by channel (what happens if Meta CPMs rise 30%?)
- Repeat purchase rate (what if retention drops 10 points?)
- COGS (what if a key ingredient increases 15%?)
- Inventory turns (what if a seasonal product sells 40% slower than projected?)
- Payment terms with suppliers (what if your 60-day terms get cut to 30?)
Scenario analysis reveals cash flow and inventory investment differences that are completely invisible when you only look at net margin. A brand projecting 15% net margin in the base case might find that a moderate downside scenario produces a cash deficit in month 8 because of inventory timing. That insight, discovered in a spreadsheet rather than in a bank account, is the entire point.
Effective profitability roadmaps combine financial, marketing, and operational scenarios into integrated models. This is not a one-time exercise. The brands that use scenario analysis well revisit their models monthly, updating assumptions as real data comes in and adjusting decisions before problems compound.
How Commerce Catalyst helps you build your roadmap
If you are ready to move from financial uncertainty to a clear, data-backed profitability strategy, Commerce Catalyst was built specifically for this moment in your brand’s growth.

Chris Wichert works directly with consumer brand founders through services like the DTC Operator Diagnostic and the financial health assessment to identify exactly where your brand is leaking profit and what to do about it. These are not generic consulting engagements. They are hands-on diagnostics grounded in the same frameworks covered in this article: cohort unit economics, CPA, scenario modeling, and marketing budget allocation. Whether you need a one-time audit or ongoing fractional CFO support, the starting point is always the same: clarity on where you actually stand.
FAQ
What is a good LTV:CAC ratio for a consumer brand?
A ratio of 3:1 or greater is the standard benchmark for healthy consumer DTC brands. Below 2:1 typically means the brand is burning cash on acquisition that customers will never repay.
How do I start building a profitability roadmap for my brand?
Start with six months of cohort data to calculate your true payback window and LTV:CAC ratio. From there, layer in customer profitability analysis and a basic three-scenario financial model.
Why does the 60/40 marketing split matter for profitability?
The 60/40 brand-to-performance split reduces long-term CAC by building lasting awareness and trust. Brands that rely entirely on performance marketing face rising acquisition costs with no brand equity to offset them.
What variables should I model in scenario analysis?
The most impactful variables for consumer brands are CAC by channel, repeat purchase rate, COGS, inventory turns, and supplier payment terms. Modeling shifts in these five areas covers the majority of profit risk.
How is customer profitability analysis different from gross margin analysis?
Gross margin only subtracts product cost from revenue. Customer profitability analysis also subtracts order processing, logistics, customer support, returns, and allocated acquisition costs to reveal true per-customer profit.