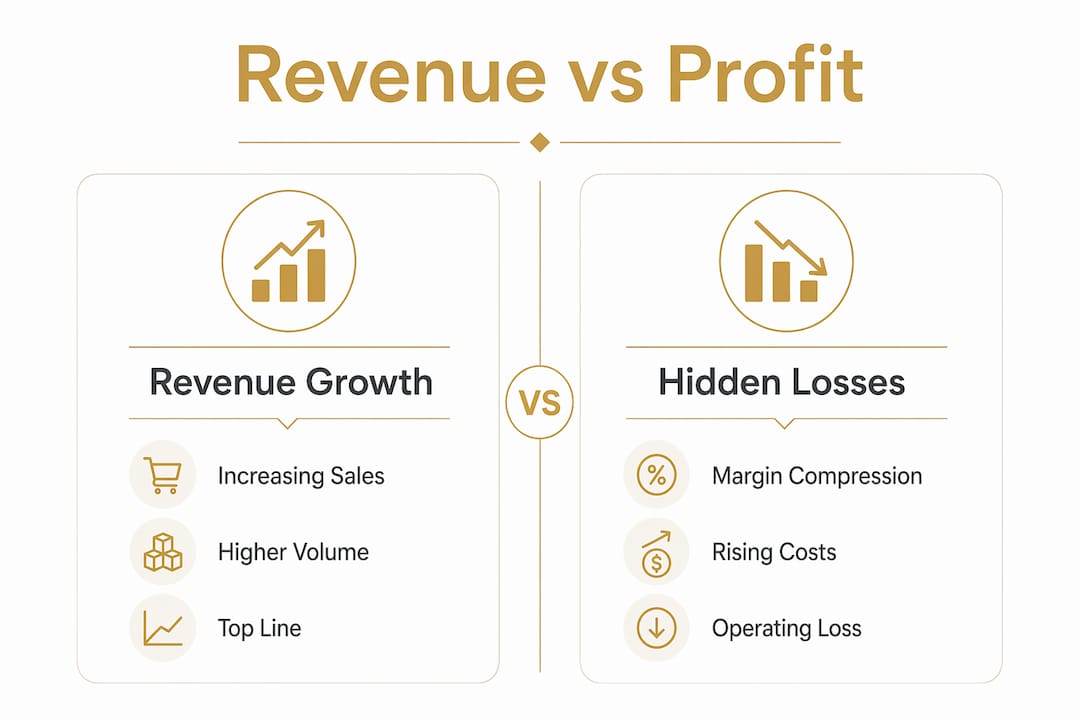
Revenue growth hides losses when expanding sales mask shrinking profit margins and rising operational costs, creating a false picture of financial health. This phenomenon, known in financial analysis as margin compression under top-line growth, is one of the most common blind spots for business leaders and boards. OpenAI reported a net loss of $9 billion on $13 billion in revenue in 2025, with projections showing $74 billion in cumulative losses by 2028 on $100 billion in revenue. That single example proves the point: revenue growth vs profitability are two entirely different stories. The Rule of 40, a benchmark requiring that ARR growth plus profit margin equals at least 40%, exists precisely because top-line figures alone tell you nothing about financial sustainability.
Why revenue growth hides losses in your financial reports
Margin compression is the core mechanism behind hidden losses. It happens when costs grow faster than revenue, shrinking the gap between what you earn and what you spend. A business can double its sales and still move further from profitability if its cost structure scales faster than its pricing power.

Gross margin measures what remains after subtracting the direct cost of goods sold from revenue. Operating margin goes further, subtracting overhead, salaries, and other operating expenses. Both metrics can deteriorate even as the top line climbs. SaaS companies may carry an 85% gross margin yet sustain monthly net losses when sales, marketing, and infrastructure costs outpace revenue growth. High gross margin is a necessary condition for profitability, but it is not sufficient on its own.
The table below shows how revenue growth and profit trends can move in opposite directions:
| Year | Revenue growth | Gross margin | Operating profit |
|---|---|---|---|
| Year 1 | 40% | 65% | $2M |
| Year 2 | 60% | 58% | $800K |
| Year 3 | 80% | 51% | ($1.2M) |
| Year 4 | 100% | 44% | ($4.5M) |
Revenue doubles while operating profit turns deeply negative. This is the pattern that misleads boards and investors who focus on the top line.
Pricing strategy is the most underused lever in this equation. A 1% improvement in pricing translates directly to an 11% increase in operating profit. That ratio dwarfs the impact of equivalent cost reductions. Most leaders reach for cost cuts first, but pricing discipline produces faster and more durable margin recovery.
Pro Tip: Track gross margin percentage month over month, not just gross margin dollars. A rising dollar figure with a falling percentage is an early warning sign that costs are outpacing growth.
- Gross margin declining while revenue grows signals cost structure problems.
- Operating expenses growing faster than revenue signals a scaling failure.
- Flat or falling contribution margin signals pricing or customer mix issues.
- Burn multiple rising signals that each dollar of new revenue costs more to acquire.
Is revenue a lagging or leading indicator of financial health?
Revenue is a lagging indicator. It validates what already happened, not what is happening now. By the time revenue growth slows, the margin damage is often months old and deeply embedded in the cost structure.
Boards focusing solely on revenue miss structural fragility hidden beneath detailed revenue reporting. Margin, by contrast, reflects current business efficiency and pricing power in real time. A business with flat revenue but improving margins is healthier than one with surging revenue and compressing margins. The direction of margin tells you where the business is going; revenue tells you where it has been.
The metrics that actually lead financial health include:
- Contribution margin: Revenue minus variable costs per unit, showing whether each sale funds fixed costs.
- CAC-to-LTV ratio: Customer acquisition cost relative to lifetime value, revealing whether growth spending pays back.
- Burn multiple: Cash burned per dollar of new ARR added, measuring growth efficiency.
- Gross margin trend: The direction of margin over rolling quarters, not just the current snapshot.
“Revenue is a poor lie detector. Margins are a rigorous, honest diagnostic of true business improvement. Leaders who report revenue without margins are presenting half a financial statement and calling it a full picture.”
Effective financial leadership requires tracking contribution margins, CAC-to-LTV ratios, burn multiples, and gross margin trends together. No single metric tells the full story. The combination reveals whether growth is creating value or consuming it.
Pro Tip: Ask your finance team to present gross margin trend alongside revenue in every board report. If the two lines diverge, that divergence is the most important conversation in the room.
What causes hidden losses during periods of revenue growth?
Hidden losses during growth periods share a set of common root causes. Recognizing them early is the difference between a correctable problem and a structural crisis.
Discount-led growth
Discounting drives volume but destroys margin. A 20% discount on a product with a 40% gross margin cuts that margin nearly in half. Revenue growth that relies on discounting is rented growth. It produces sales figures that look healthy while quietly eroding the unit economics that make the business viable. When discounts become the primary acquisition tool, the business trains customers to wait for promotions and loses pricing power permanently.
Unprofitable customer segments
Not all revenue is equal. A business serving a mix of high-margin and low-margin customers may show strong aggregate revenue while the low-margin segment consumes a disproportionate share of operational resources. Product lines sold at thin margins to large accounts often require more support, more customization, and more logistics than the margin justifies. Cutting or repricing those segments feels counterintuitive when revenue is growing, but it is often the fastest path to profit improvement.
Capital intensity that scales with volume
In capital-intensive models, costs do not fall as volume rises. In AI, inference costs do not decrease with scale, causing growing losses despite revenue growth. This contradicts the traditional assumption that scale improves unit economics automatically. Businesses built on compute, logistics, or physical infrastructure face the same dynamic. More revenue means more cost, and the margin never improves without a structural change to the cost model.
| Cause | Effect on margin | Warning sign |
|---|---|---|
| Discount-led growth | Gross margin erosion | Rising volume, falling margin % |
| Unprofitable segments | Operating loss on specific lines | High revenue, low contribution margin |
| Capital intensity | Losses scale with volume | Costs grow faster than revenue |
| Overhead bloat | Operating margin collapse | Headcount growing faster than revenue |
Pro Tip: Run a profitability analysis by customer segment and product line quarterly. Revenue that looks healthy at the aggregate level often conceals loss-making segments that drag down the whole business.
How to uncover and manage hidden losses beneath revenue growth
The first step is separating revenue from profitability in every financial review. Leaders who diagnose unprofitable revenue streams early avoid the compounding damage of funding losses with growth capital.
-
Audit gross margin by product and channel. Calculate gross margin for each revenue stream independently. Aggregate gross margin hides the segments that are destroying value.
-
Review pricing against cost inflation. If input costs have risen and prices have not, margin compression is already underway. A pricing strategy for sustainable profit must account for cost changes in real time, not annually.
-
Measure operating use. Operating use is the ratio of revenue growth to operating expense growth. If expenses grow faster than revenue, the business is scaling inefficiency, not efficiency.
-
Apply the Rule of 40 as a checkpoint. The Rule of 40 benchmark requires that ARR growth rate plus profit margin equals at least 40%. Businesses below this threshold at Series B and beyond are typically burning capital without building durable value.
-
Cut or reprice unprofitable revenue. Eliminating a revenue stream feels like a loss but often improves net profit immediately. Examples of unprofitable revenue streams include low-margin wholesale accounts, heavily discounted subscription tiers, and product lines with high return rates.
-
Run a structured financial diagnostic. A formal assessment maps the full cost structure against revenue by segment, identifies margin leaks, and prioritizes the fixes with the highest profit impact. Gross margin improvement starts with knowing exactly where margin is being lost, not with broad cost-cutting.
Cost-cutting without fixing root causes creates fragility and risks a growth death spiral. Cutting overhead while leaving broken pricing or unprofitable segments intact only delays the reckoning. The fix must address the structural cause, not the symptom.
Key Takeaways
Revenue growth hides losses when margin compression, rising costs, and unprofitable segments go untracked beneath an expanding top line.
| Point | Details |
|---|---|
| Margin beats revenue as a health signal | Gross and operating margin reveal current business efficiency; revenue only confirms past sales. |
| Pricing outperforms cost-cutting | A 1% pricing improvement drives an 11% operating profit gain, far exceeding equivalent cost reductions. |
| Discount-led growth is rented growth | Discounting inflates revenue while eroding unit economics and long-term pricing power. |
| Capital intensity breaks scale assumptions | In AI and logistics, costs can scale with volume, meaning more revenue produces more losses. |
| Segment-level analysis is non-negotiable | Aggregate revenue masks loss-making product lines and customer segments that drag down total profit. |
The metric leaders should be watching instead
I have worked with founders who could recite their monthly revenue to the dollar but had no idea what their contribution margin was. That gap is not a data problem. It is a leadership priority problem.
Revenue is the number that feels good to report. It goes up, the team celebrates, the board nods. But margins expose the truth that revenue conceals. I have seen businesses with $10 million in annual revenue that were structurally insolvent because no one had ever mapped the cost of serving each customer segment. The revenue line looked fine. The margin told a completely different story.
The instinct to cut costs when margins compress is understandable but usually wrong as a first move. Cutting overhead without fixing pricing or eliminating loss-making segments is like bailing water from a boat with a hole in it. You stay afloat temporarily, but the problem compounds. The right sequence is diagnosis first, then targeted action on the highest-impact levers.
What I tell every founder I work with: your gross margin is your honesty metric. It does not care about your growth narrative or your investor deck. It tells you whether the business model actually works at the unit level. If that number is trending down while revenue trends up, you are not building a business. You are building a liability that looks like a business.
The leaders who catch this early are the ones who track margin trends alongside revenue in every review, not as an afterthought. They ask the uncomfortable question: “Are we growing into profit or growing away from it?” That question, asked consistently, is worth more than any financial model.
What a financial diagnostic reveals about your profitability
Growing revenue without growing profit is a pattern Commerce Catalyst sees regularly in consumer brands and DTC businesses. The numbers look strong on the surface. The margin tells a different story underneath.

Commerce Catalyst’s financial health assessment maps your full cost structure against revenue by segment, identifies where margin is leaking, and prioritizes the fixes with the highest profit impact. For founders who need ongoing support, the fractional CFO service provides the financial leadership to balance growth targets with sustainable profitability. If you are not certain where your losses are hiding, a structured diagnostic is the fastest way to find out.
FAQ
Why does revenue growth hide losses?
Revenue growth hides losses when rising sales mask declining profit margins and escalating costs. The top line grows while the gap between revenue and expenses narrows or turns negative, a pattern called margin compression.
What is the difference between revenue growth and profitability?
Revenue growth measures the increase in total sales. Profitability measures what remains after all costs are paid. A business can grow revenue rapidly while becoming less profitable if costs scale faster than prices.
How can I spot hidden losses in financial reports?
Track gross margin percentage and operating margin alongside revenue in every reporting period. A falling margin percentage alongside rising revenue is the clearest signal that losses are building beneath the top line.
What is the Rule of 40 and why does it matter?
The Rule of 40 requires that a company’s ARR growth rate plus its profit margin equals at least 40%. It is a benchmark that forces leaders to balance growth speed against profitability, preventing the trap of chasing revenue at any cost.
Can growth mask financial struggles long-term?
Growth can mask financial struggles for extended periods, especially when backed by external capital. The underlying damage compounds over time, and when funding slows, the structural losses become impossible to ignore.