A working capital playbook is a prioritized, repeatable set of operational moves, mostly in accounts receivable, inventory, and payables, that free up cash without borrowing a dollar. Run correctly, it lowers your Cash Conversion Cycle, cuts the volatility that keeps CFOs up at night, and buys the business room to grow on its own money. The first move is not a strategy offsite. It’s arithmetic: calculate your Cash Conversion Cycle (CCC), compare your Days Sales Outstanding (DSO) against your industry benchmark, and if DSO is your biggest gap, launch a 30-day accounts receivable sprint before you touch anything else.
That sequencing matters more than most finance teams assume. Businesses that treat working capital as a quarterly review exercise miss the weekly cash traps that actually drain liquidity. The playbook works in a specific order:
- Measure your CCC and its three components (DIO, DSO, DPO) against industry norms
- Prioritize the single lever with the fastest, largest dollar impact
- Pilot that lever for 30 to 60 days with a clear success threshold
- Govern the gain weekly so it doesn’t erode back to baseline
Pro Tip: Before you touch collections calls or dunning emails, fix invoice delivery. Sending accurate invoices the moment a transaction closes, then routing customers to a self-service payment option, removes friction that causes late payment in the first place, and it’s often the fastest lever available for cutting DSO.
Key Takeaways
The Working Capital Playbook works because it converts a vague cash problem into a measurable, prioritized sequence: measure CCC, run a focused 30-day sprint on the biggest gap, then govern weekly to lock in the gain.
| Point | Details |
|---|---|
| Calculate CCC first | Measure DIO, DSO, and DPO before choosing any lever, so you know where the real gap is. |
| Prioritize the fastest lever | If DSO is largest, run a 30-day AR sprint focused on invoice delivery and self-service payment. |
| Translate days into dollars | Convert every CCC improvement into a dollar figure to build stakeholder momentum and buy-in. |
| Govern weekly, not monthly | Weekly review cadence catches cash traps that monthly averages hide until it’s too late. |
| Get a structured diagnostic | Commerce Catalyst’s financial health assessment baselines your CCC and scopes a 30-day sprint for growth-stage brands. |
Table of Contents
- What Is a Working Capital Playbook and How Does It Differ From Cash Flow Management?
- What Are the Six Core Levers for Working Capital improvement?
- How Do You Build and Run a Working Capital Playbook?
- How Do You Measure and Benchmark Working Capital Performance?
- Which Technology and Process Changes Actually Move Working Capital?
- What Results Have Businesses Actually Achieved With This Playbook?
- Practitioner Perspective: What Actually Trips Up Working Capital Initiatives
- How Commerce Catalyst Helps You Implement This Playbook
- Sources
What Is a Working Capital Playbook and How Does It Differ From Cash Flow Management?
Working capital is current assets minus current liabilities, the cash tied up in receivables, inventory, and prepaid expenses, net of what you owe suppliers and short-term creditors. It’s a balance sheet snapshot. Cash flow, by contrast, measures timing: when money actually moves in and out of your accounts. You can be profitable and working-capital-healthy on paper while still running short on cash mid-month because collections lag payroll. That gap is exactly why CFOs need both a structural discipline (working capital management) and a timing discipline (cash flow management) running in parallel.
The connector between the two is the Cash Conversion Cycle, and it’s the single most useful number in this entire playbook.
Days Inventory Outstanding (DIO) measures how long inventory sits before it sells. Days Sales Outstanding (DSO) measures how long it takes to collect cash after a sale. Days Payable Outstanding (DPO) measures how long you take to pay suppliers. A lower CCC means faster cash conversion and greater liquidity, full stop. If your CCC is 60 days and you shave off 10, that’s not an abstract improvement. On $50 million in annual revenue, 10 days of CCC compression translates to roughly $1.4 million in freed cash, money you’re no longer financing through a revolver or delaying payroll to cover.
Two more terms matter here. The Collection Effectiveness Index (CEI) measures how much of your collectible receivables you actually collect within a period, a sharper lens than DSO alone because DSO can be skewed by sales mix and seasonality. And KPMG recommends that leading finance teams move past blunt averages entirely, using transaction-level metrics like Weighted Average Terms (WAT) and Weighted Average Days to Collect (WADC) to find where the real drag lives. More on that below.
Working capital improvement, in short, is the structural work: fixing terms, processes, and inventory policy. Cash flow management is the weekly tactical work of keeping the lights on. You need both, but the playbook starts with the structural side because that’s where durable gains live.
What Are the Six Core Levers for Working Capital improvement?
There are six levers that move working capital, and not all of them deserve equal attention at the same time. Here’s how to think about each one, what to do, and how fast you should expect to see results.
Accelerate accounts receivable. Fix invoice accuracy and delivery speed first, then add automated reminders, then offer multiple self-service payment options (ACH, card, wire) so customers aren’t waiting on a check to clear. Expect measurable DSO movement within 30 to 45 days. Watch DSO and CEI.

Tighten accounts payable. This isn’t just “pay suppliers later.” It means renegotiating terms where you have use, consolidating vendors to increase your negotiating position, and using early-payment discounts selectively when the discount rate beats your cost of capital. Impact shows up over 60 to 90 days as renegotiated terms take effect. Watch DPO and the ratio of discounts captured versus missed.
Reduce inventory carrying costs. Run ABC analysis to separate fast movers from dead stock, tighten reorder points using actual sell-through data instead of gut feel, and set a hard clearance policy for anything sitting past a defined threshold. This lever moves slower, often 90 to 120 days, because inventory decisions ripple through purchasing cycles already in motion. Watch DIO and inventory turnover.
Improve cash visibility and forecasting. Build a rolling 13-week cash flow forecast updated weekly, not monthly. This is process work, not a big technology lift, and it pays off almost immediately in decision quality even before any dollar moves. Watch forecast accuracy (actual versus projected) as your core metric.
Track the right KPIs. DSO, DPO, DIO, CCC, CEI, current ratio, and receivables turnover all tell a different part of the story. Pick four you’ll report weekly and hold the line on those instead of drowning stakeholders in twelve.
Reduce financing dependence. Every dollar you free through the five levers above is a dollar you don’t need to borrow. This is the compounding payoff: less revolver draw, better terms on the debt you do carry, and more negotiating use with lenders because your balance sheet looks disciplined.
CCC benchmark check: A CCC under 30 days is generally considered strong for consumer brands; above 60 days signals real improvement opportunity, particularly if DSO is the primary driver.
Pro Tip: Don’t manage AR with a single blended DSO number. Segment by customer and channel, then calculate Weighted Average Days to Collect (WADC) for each segment. A blended DSO of 45 days can hide one channel at 20 days and another at 90, and you’ll only find the 90-day problem if you look at the transaction level.
How Do You Build and Run a Working Capital Playbook?
Governance is what separates a working capital initiative that produces a quarter of good headlines from one that sticks. Sustained gains require process change, automation, and governance operating together, not a one-time project that fades once the person who championed it moves on.
Here’s the sequence that works in practice:
- Form a small steering group. One owner each for AR, AP, and inventory, plus the CFO or controller chairing a weekly 30-minute cadence call. Not a committee. A working group that reviews numbers and clears blockers.
- Baseline everything before you touch anything. Calculate current DIO, DSO, DPO, and CCC. Without a clean baseline, you can’t prove the pilot worked.
- Pick one lever and scope a 30-day pilot. Operator playbooks consistently favor this cash-first approach: measure the baseline, choose the fastest lever, and report results in dollars, not percentages, to build stakeholder momentum.
- Set a success threshold before you start. A 5-day DSO reduction, a specific dollar figure released, or a target CEI improvement. Define it in writing.
- Run the pilot, review weekly, adjust fast. Weekly cadence catches problems before they compound into a full quarter of drift.
- Scale what worked, kill what didn’t. Extend the successful pilot to a second segment or lever. Document the process so it survives staff turnover.
- Lock gains into standard operating procedure. BCG’s research on capital allocation points to central governance and feedback loops as the mechanism that keeps gains from sliding back to baseline once initial enthusiasm fades.
Cost and timeline vary sharply by lever. Fixing invoice delivery and adding self-service payment options can happen in two to four weeks with minimal spend, mostly process and configuration work inside tools you likely already own. Full AR automation platforms or ERP integration projects run three to six months and carry real implementation cost. Start cheap, prove the model, then justify bigger technology spend with your own pilot data.
- Week 1 to 2: Baseline metrics, form steering group, select pilot lever
- Week 3 to 6: Run 30-day sprint, weekly review cadence
- Week 7 to 12: Evaluate results, scale to second segment, document SOP
- Month 4 onward: Layer in automation for the highest-friction manual steps
How Do You Measure and Benchmark Working Capital Performance?
Monthly averages are the enemy here. A monthly DSO figure can look stable while masking a week where a major customer paid 45 days late and nearly triggered a payroll shortfall. A weekly KPI cadence focused on cash impact surfaces these traps while they’re still fixable, not after the quarter closes.
Translating days into dollars is what actually gets a CFO buy-in from the rest of the leadership team. Here’s how small CCC movements scale on a $30 million revenue business:
| CCC Improvement | Days Reduced | Approximate Cash Released |
|---|---|---|
| Modest AR sprint win | 5 days | ~$411,000 |
| Combined AR + AP tightening | 15 days | ~$1,233,000 |
| Full-lever improvement | 30 days | ~$2,466,000 |
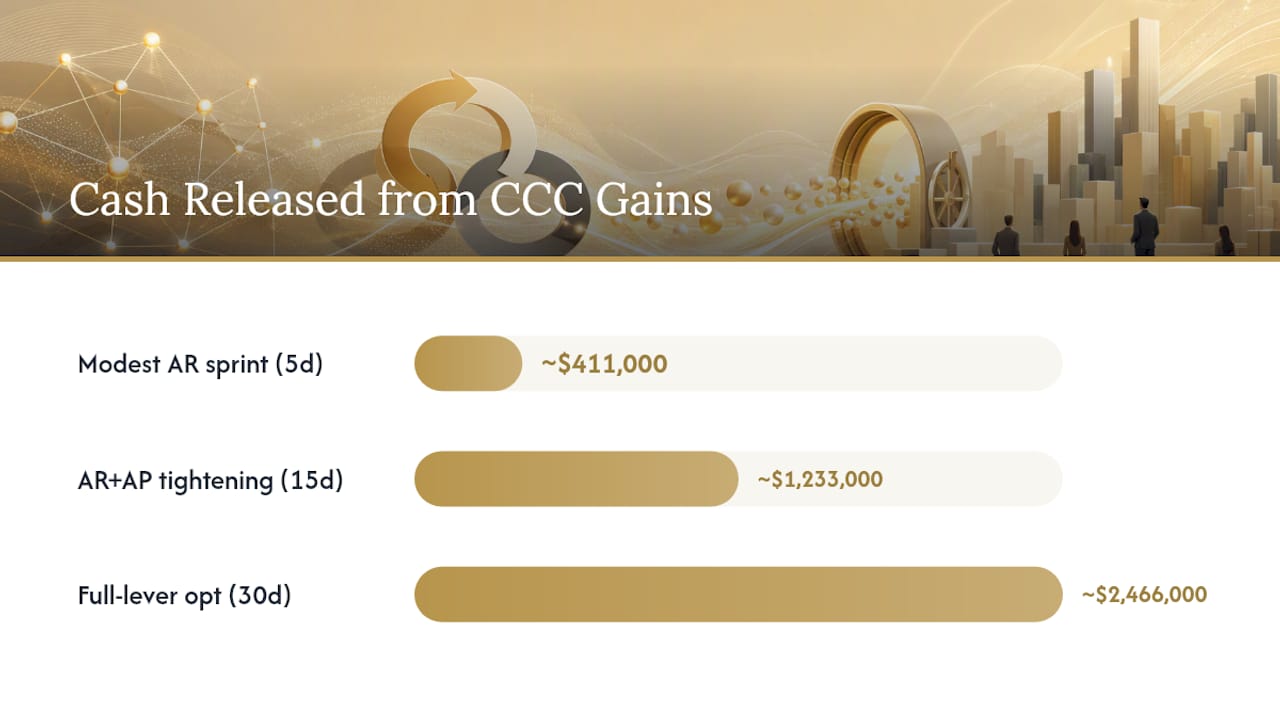
(Calculated as daily revenue run rate multiplied by days of CCC improvement; actual results depend on margin structure and payment mix.)
Segmentation sharpens this further. Rather than tracking one blended DSO, KPMG’s transaction-level approach using WAT and WADC lets you isolate which customer cohort, region, or product line is actually dragging your average down. A customer profitability lens applied alongside WADC often reveals that your slowest-paying accounts are also your least profitable ones, a double reason to renegotiate terms or tighten credit limits there specifically.
CEI complements DSO by measuring collection effectiveness independent of sales volume swings, so a strong month of sales doesn’t artificially flatter your DSO trend while masking a real collections problem underneath.
Pro Tip: Report CCC and its components weekly to the steering group, but save the full board-level review for monthly. Weekly catches the traps; monthly tells the story to people who don’t need the noise.
Which Technology and Process Changes Actually Move Working Capital?
Automation earns its keep only when it removes a genuine bottleneck; buying a platform to solve a process problem usually just moves the mess somewhere faster. The features that consistently deliver measurable working-capital improvement are narrower than most vendor pitch decks suggest.
- Instant invoice generation and delivery immediately after order fulfillment or service completion, removing the days-long lag that starts every collection clock late
- Electronic payment options (ACH, card, real-time payment rails) built directly into the invoice, since self-service payment removes a documented source of payment delay
- Cash-application automation that matches incoming payments to open invoices without manual reconciliation, freeing staff time for the accounts that actually need judgment
- Dispute and deduction workflows that route billing disagreements to resolution instead of letting them sit unpaid indefinitely
- A single source of truth between your ERP and CRM so sales, finance, and operations aren’t working from three different views of what a customer owes
Vendor selection should follow a capability checklist, not a features list. Must-haves: real-time ERP sync, self-service payment, automated cash application. Nice-to-haves: predictive collections scoring, multi-entity consolidation, AI-driven dispute routing. If a platform can’t do the must-haves cleanly, the nice-to-haves don’t matter.
For a proof of concept, pick one business unit or customer segment, run it for 60 days, and measure DSO and CEI before scaling company-wide. Founder financial blind spots often trace back to exactly this kind of fragmented data, where AR, inventory, and cash forecasts each live in a different tool with no shared source of truth.
What Results Have Businesses Actually Achieved With This Playbook?
Numbers matter more than theory here. One documented AR automation case, McPherson Oil, reduced DSO by 26% and unlocked $2 million in previously trapped cash after automating invoice delivery and payment collection. In the same research, 87% of surveyed firms reported faster processing speeds after implementing AR automation, a strong signal that the mechanism (removing manual friction from invoice-to-cash) generalizes well beyond any single company.
A second pattern shows up on the inventory and governance side rather than the technology side. Businesses that pair ABC inventory segmentation with a weekly governance cadence, rather than relying purely on new software, tend to see DIO reductions play out over 90 to 120 days as purchasing and sales teams adjust reorder behavior to actual sell-through data instead of historical habit.
- AR automation gains concentrate in businesses with high invoice volume and repeat B2B customers, where friction removal compounds across many transactions
- Inventory-led gains concentrate in businesses with SKU-heavy catalogs where dead stock has been accumulating unaddressed for multiple cycles
- Neither result transfers cleanly to a business with concentrated, low-volume, high-touch customer relationships, where the constraint is usually negotiation use, not process friction
Context matters more than the headline percentage. A DTC brand with 200 wholesale accounts and a five-person AR team gets a different return from automation than a business with three enterprise customers who negotiate terms directly with the CFO.
Practitioner Perspective: What Actually Trips Up Working Capital Initiatives
The first is managing by monthly averages. A monthly DSO of 42 days sounds fine until you realize it’s an average of a week at 25 days and a week at 65 days, because one customer blew through their payment terms and nobody flagged it until the close. Weekly cash-impact reporting catches that volatility while there’s still time to act. Monthly reporting tells you about it after the damage is done.
The second is treating accounts payable purely as a negotiation exercise, extend terms, squeeze vendors, and call it improvement. That approach works exactly once. Suppliers remember who stretched them thin during a tight quarter, and that memory shows up later as worse pricing, slower fulfillment priority, or a flat refusal to extend terms again when you actually need it. The better move is segmenting suppliers the same way you segment customers: protect the relationships that matter for supply continuity, and negotiate hard only where the relationship can absorb it.
None of this works without buy-in across sales, operations, procurement, and finance, and that’s the part most working capital projects skip. Sales teams resist tighter credit terms because they fear lost deals. Operations resists inventory discipline because stockouts feel riskier than carrying cost. The fix isn’t a mandate from finance. It’s a shared weekly number everyone can see, tied to an incentive that rewards the behavior you actually want, whether that’s faster invoice turnaround from ops or cleaner credit checks from sales before a deal closes. Communicate the plan before you launch it, not after something breaks, and give each function a guardrail they helped set rather than one imposed on them.
How Commerce Catalyst Helps You Implement This Playbook
Reading a playbook and running one under real operating pressure are different things, and most finance teams at growth-stage consumer brands don’t have a spare eight weeks to build a governance cadence from scratch while also closing the books. That’s the gap Commerce Catalyst fills.

Engagements typically start with the same diagnostic sequence this article recommends: a full financial health assessment that baselines your CCC, DSO, DPO, and DIO against your specific business model, followed by a scoped 30-day sprint targeting the single highest-impact lever, then ongoing fractional CFO support to govern the gains so they don’t erode. One proof point from this approach: a DTC brand turnaround that identified $3 million in recoverable cost and cash inefficiency through exactly this diagnostic-to-sprint sequence. If your team is staring at a CCC that’s drifted longer than it should be and no clear owner to fix it, start with the operator diagnostic to scope what a 30-day sprint would actually target for your business.
Sources
- How to improve working capital | KPMG
- Working capital improvement strategies | Billtrust
- How to improve working capital without financing | Calculum