Financial blind spots silently convert surface revenue into margin erosion, degraded customer experience, and permanent brand-value loss. The damage rarely announces itself. Instead, it compounds quietly across channels, cost centers, and reporting cycles until a cash crunch, a write-down, or a valuation conversation forces the reckoning. Growth can mask structural weaknesses for months or years, creating the illusion of progress while the underlying financial architecture deteriorates. For consumer brand founders managing mid to upper single-digit million revenue up to several tens of millions, that lag time is the real risk.
Three things you can do in the next 48–72 hours to stop the biggest leaks:
- Pull a channel-level gross margin report for the last 90 days. If you cannot generate one in under an hour, that inability itself is the first blind spot.
- Ask your finance lead for a reconciliation of your top three ad campaigns against fully loaded order-level cost, including fulfillment, returns, and platform fees. The gap between dashboard ROAS and actual contribution margin is almost always larger than expected.
- Calculate your cash runway under three scenarios: current burn, a 20% revenue drop, and a 20% cost spike. If any scenario produces a runway under 90 days, that is a board-level conversation, not a finance-team task.
Most CPG and DTC brands cannot answer the question “are we profitable today?” at the channel level. Daily visibility into channel-level margins can often recover significant lost margin:some brands have identified $200,000 or more in annual margin recovery:simply by surfacing costs that were always there but never attributed correctly.
Table of Contents
- What financial blind spots do growing consumer brands most often miss?
- How do these blind spots actually damage your brand?
- How do you spot financial blind spots fast?
- What does a 30–90 day fix actually look like?
- When should you DIY, and when does outside help make sense?
- How does expert advisory actually fix blind spots?
- Key Takeaways
- The case for leading with financial clarity
- What Commerce Catalyst can do for your brand right now
- Useful sources and further reading
What financial blind spots do growing consumer brands most often miss?
A financial blind spot is any gap between what your reporting tells you and what is actually happening in the business. For scaling consumer brands, seven patterns show up repeatedly, and each one is easy to rationalize away when revenue is trending upward.
Revenue without unit economics. Tracking gross sales without contribution margin per channel or per SKU is the most common starting point. A brand can be showing significant revenue growth while every incremental dollar of revenue destroys margin. The types of founder financial blind spots that matter most at scale almost always start here.

Hidden cash-flow pressure. Timing mismatches between when you pay suppliers, when inventory lands, when marketplace platforms settle, and when 3PL invoices arrive create a structural cash gap that does not show up in a monthly P&L. A brand doing $20M in revenue can be technically profitable on paper and genuinely cash-constrained at the same time.
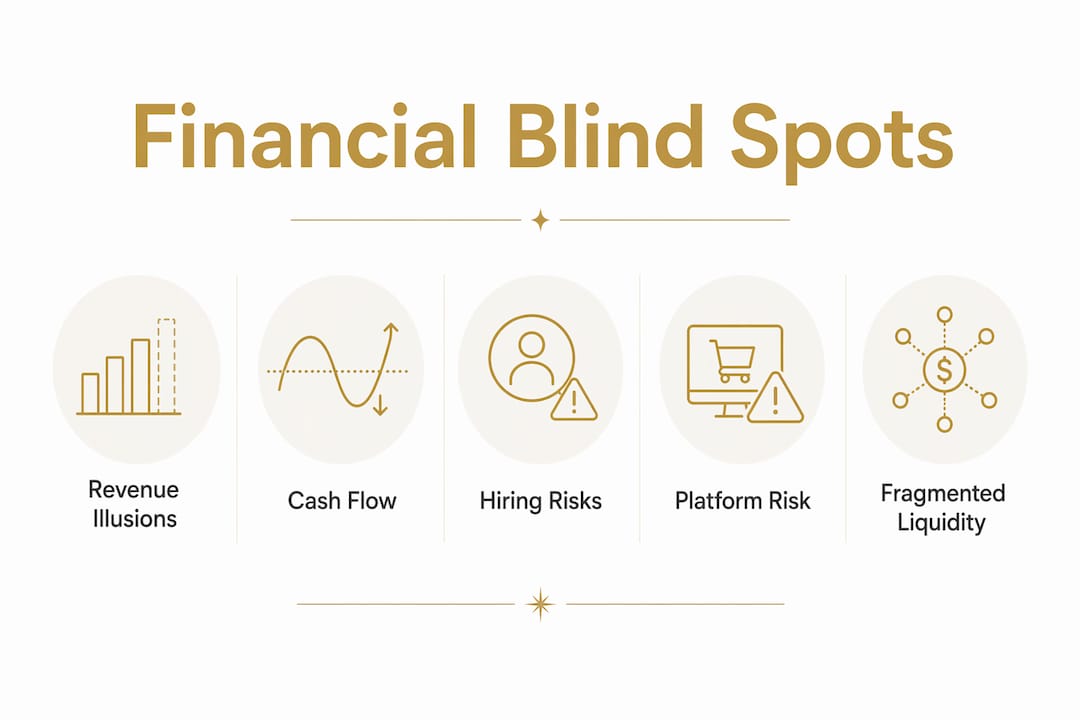
Hiring ahead of operations. Scaling headcount before fulfillment capacity, process infrastructure, or systems are in place converts variable cost into fixed cost prematurely. When revenue softens, that cost structure becomes a trap.
Platform and channel concentration. Algorithm dependency is a quantifiable board-level risk, not a marketing concern. When more than 50% of your revenue flows through a single platform, a feed change or policy update is a financial event, not just a traffic dip. Translating that exposure into a dollar figure is what converts it from a complaint into a budgeted hedge.
Fragmented liquidity. Fragmented cash across channels and entities creates a situation where one subsidiary or channel hoards safety cash while another draws on a revolving credit line at 8–12% interest. The net interest cost is avoidable, but only if you can see the full picture.
Attribution illusions. Marketing dashboards can misrepresent acquisition economics by reporting platform-level ROAS while the fully loaded P&L, including fulfillment, returns, platform fees, and overhead allocation, shows campaigns are loss-making. The dashboard is not lying. It is just answering a different question than the one that matters.
Outgrowing DIY processes. Spreadsheets and month-end close cycles that worked at $3M become liabilities at $15M. Stale data means decisions are made on last month’s reality, not today’s. By the time the numbers arrive, the window to act has often already closed.
How do these blind spots actually damage your brand?
The harm is not abstract. Each blind spot produces a specific cascade of outcomes, and the further downstream you let it run, the more expensive the remediation.
Margin compression is the most immediate consequence. When contribution margin per channel is invisible, pricing decisions, promotional calendars, and channel mix choices are made without a cost floor. Forced discounting follows, which trains customers to wait for sales, erodes perceived value, and makes the brand progressively harder to price at full margin. Brand strategy choices that increase exposure to cash flow volatility compound this effect, particularly when extension decisions or channel dilution are made without a clear read on which revenue streams are actually profitable.
The longer-term brand consequences are where the real destruction happens. When cash is constrained, the first cuts are usually in product quality, packaging, customer service staffing, and marketing investment, precisely the touchpoints that build or erode brand equity. As one analysis of brand management put it:

The Kraft Heinz case made this point at scale: aggressive cost-cutting and margin expansion, with brands treated as durable assets requiring minimal reinvestment, produced a $15.4 billion writedown and an SEC investigation. The brands had not maintained their value without investment. They had eroded. For a $20M DTC brand, the same dynamic plays out in miniature: inventory write-downs, rising CAC as brand consideration weakens, and a valuation multiple that compresses precisely when the founder needs it to hold.
Financial engineering and heavy use accelerate this trajectory. Claire’s UK operations entered administration in part because debt service consumed funds that should have gone to customer experience and product quality. The brand degradation and insolvency were not separate events. One caused the other.
How do you spot financial blind spots fast?
The fastest diagnostic is not a software purchase. It is a structured set of questions and data pulls that any founder can run in a single day.
A one-day diagnostic checklist
- Request a channel-level P&L for the last 90 days, broken down by gross revenue, returns, platform fees, fulfillment cost, and contribution margin.
- Pull your top 10 SKUs by revenue and rank them by contribution margin. Identify any SKU where margin is negative or below 20%.
- Ask your finance lead for days sales outstanding (DSO) and inventory days on hand. Compare both to your payment terms with suppliers.
- Calculate what percentage of total revenue comes from your top two platforms or channels. If that number exceeds 50%, you have a concentration exposure worth quantifying in dollar terms.
- Request a reconciliation of your three largest ad campaigns: platform-reported ROAS versus fully loaded order-level cost. The gap is your attribution illusion.
- Map your cash inflows and outflows by week for the next 12 weeks. Identify any weeks where outflows exceed inflows by more than 15%.
- Ask whether your current reporting cycle delivers margin data within 48 hours of the period close. If the answer is no, your decision lag is a structural risk.
KPIs that reliably reveal blind spots
| KPI | What it reveals | Warning threshold |
|---|---|---|
| Gross margin by channel (daily) | Channel profitability and pricing floor | Below 20% for DTC; below 20% for wholesale |
| Contribution margin per SKU | True product-level economics | Negative or below 15% |
| Days sales outstanding (DSO) | Receivables drag on cash | Above 45 days |
| Inventory days on hand | Capital tied up in stock | Above 90 days for most CPG |
| Fully loaded CAC (ad-to-order) | Real acquisition cost vs. dashboard ROAS | CAC exceeding 30% of first-order revenue |
| Platform revenue concentration | Channel dependency exposure | Single platform above 50% of revenue |
| Net cash flow (weekly) | Actual liquidity position | Negative for two or more consecutive weeks |
| Contribution margin per channel | Channel-level viability | Below 20% after all variable costs |
For financial KPIs tailored to consumer brands, the thresholds above are starting points, not absolutes. Context matters: a brand with strong repeat rates can sustain a higher first-order CAC than one dependent on paid acquisition for every sale.
Three-scenario cash-runway formula
Cash runway (in weeks) = Current cash balance ÷ Weekly net cash outflow.
Run it three ways. Best case: use current revenue and current costs. Likely case: reduce revenue by 15% and hold costs flat. Worst case: reduce revenue by 30% and add a 10% cost increase (supplier repricing, 3PL rate adjustments, or platform fee changes). If your worst-case runway falls below a critical threshold, that is not a finance-team problem. It is a founder problem, and it needs to be addressed before the next growth initiative.
What does a 30–90 day fix actually look like?
The playbook has three phases, and the sequencing matters as much as the tactics.
Days 1–30: build the data foundation
The first priority is getting accurate, timely data. Reconcile order-level costs across every channel. Normalize ad reporting to your P&L by pulling platform spend into a single view alongside fulfillment, returns, and fees. Establish a weekly margin review cadence, even if the first few sessions surface uncomfortable numbers. This phase is about visibility, not yet about fixing.
Quick margin wins in this window: identify your lowest-margin SKUs and either reprice, bundle, or pause promotion on them. Renegotiate marketplace settlement terms if you have the volume to do so. These moves often recover a few margin points without touching revenue.
Days 31–90: close the process gaps
Automate the data pulls that are currently manual. If your team spends more than four hours per week reconciling channel reports, that time cost is a symptom of a process gap, not a staffing gap. Implement contribution-margin-based bidding for paid channels: set a floor below which no campaign runs, regardless of ROAS. Centralize cash visibility across all entities and channels so you can see the full liquidity picture in one place. For brands with multiple subsidiaries or marketplace accounts, this step alone often reduces net interest expense materially.
Months 3–6: structural changes
This is where the larger levers live: funding structure, owned-channel buildout to reduce platform concentration, and liquidity centralization through intercompany sweep mechanics. A profitability roadmap for this phase should include scenario-based forecasting, not just a single budget line. Building a content strategy that reduces algorithm dependency is part of this work too. Content strategy frameworks that prioritize owned channels and email reduce the dollar exposure of any single platform’s feed change.
Intervention comparison
| Intervention | Time to impact | Cost/effort | Risk if skipped |
|---|---|---|---|
| Weekly channel margin review | 1–2 weeks | Low | Continued margin erosion |
| Order-level cost reconciliation | 2–4 weeks | Medium | Attribution illusions persist |
| Contribution-margin bidding floor | 2–6 weeks | Low | Loss-making campaigns continue |
| Cash visibility centralization | 4–8 weeks | Medium | Avoidable interest expense |
| Owned-channel diversification | 3–6 months | High | Platform concentration exposure |
| Scenario-based forecasting | 4–8 weeks | Medium | No early warning on cash crunch |
Pro Tip: Before you automate anything, reconcile manually for two weeks. Automation built on bad data produces bad outputs faster. The manual pass almost always surfaces a categorization error or a missing cost line that changes the margin picture significantly.
Pro Tip: Translate your platform concentration exposure into a dollar figure and put it in your risk register. A risk register entry with a dollar figure gets board attention and budget. An abstract concern about algorithm dependency does not.
When should you DIY, and when does outside help make sense?
The honest answer depends on three variables: the speed of the problem, the quality of your internal data, and whether your finance team has the bandwidth and skill to run a diagnostic while also closing the month.
If your gross margin has compressed by more than 5 percentage points in the last 12 months and you cannot explain why, that is a speed-of-decline signal that warrants outside help. If your internal reporting cycle takes more than two weeks to produce channel-level margin data, your team cannot run a fast diagnostic without disrupting normal operations. And if you are preparing for a fundraise, an acquisition conversation, or a strategic partnership, the cost of a blind spot discovered by a counterparty is always higher than the cost of finding it yourself first.
Questions to ask before hiring an advisor
- What does your diagnostic scope cover, and what data do you need from us on day one?
- What are the specific deliverables, and who owns implementation after the engagement ends?
- What is a realistic timeline to first insight, and what does “success” look like at 30, 60, and 90 days?
- Have you worked with brands at our revenue scale and channel mix? What did you find, and what changed?
- Do you work on a fixed-scope basis, or does the engagement expand based on what you find?
Engagement formats and time-to-impact
A one-off diagnostic typically delivers a prioritized finding set within two to four weeks. A 90-day sprint adds implementation support and usually produces measurable margin improvement within the engagement window. An ongoing fractional CFO or fractional COO engagement embeds the weekly cadence and accountability structure that prevents blind spots from re-forming after the initial fix. The right format depends on whether you need a diagnosis, a repair, or a permanent change to how the business runs.
How does expert advisory actually fix blind spots?
The methodology that works is not complicated, but it requires discipline and access to data that most founders have not organized before the engagement starts.
A quality engagement begins with rapid data intake: order-level exports, channel P&Ls, ad account access, and a cash flow statement for the last 12 months. From there, the work moves to order-level reconciliation, matching every revenue dollar to its associated costs across fulfillment, returns, fees, and ad spend. Channel-level contribution analysis follows, producing a clear view of which channels are profitable, which are marginal, and which are destroying value while appearing healthy on a dashboard.
Liquidity centralization and weekly forecasting cadence are the structural outputs. The goal is not a one-time report. It is a system the founder’s team can run independently after the engagement ends.
That framing applies directly to the advisory work. When founders treat financial clarity as an asset rather than an administrative burden, the decisions that follow are categorically different. Pricing holds. Channel mix improves. CAC comes down because the brand is not subsidizing loss-making acquisition with margin from profitable channels.
In practice, brands that move from monthly to daily channel-margin visibility and implement order-level reconciliation often identify significant margin recovery within the first 60 days. The profitability best practices that produce durable results share a common thread: they start with data integrity, not with cost-cutting.
Chris Wichert’s work at Commerce Catalyst is built on this methodology. The DTC Operator Diagnostic and Founder Advisory engagements are designed to surface the specific blind spots most likely to be limiting a brand at its current revenue stage, and to transfer ownership of the fix to the founder’s team, not create a dependency on ongoing advisory.
Key Takeaways
Financial blind spots convert visible revenue into hidden margin erosion, and the brands that close them fastest are the ones that treat financial clarity as a strategic asset, not an accounting function.
| Point | Details |
|---|---|
| Revenue does not equal health | Channel-level contribution margin, not gross sales, is the number that tells you whether growth is creating or destroying value. |
| Attribution illusions are costly | Fully loaded order-level cost reconciliation almost always reveals campaigns that look efficient on a dashboard but are loss-making on a P&L. |
| Platform concentration is a dollar risk | Translate your top-platform revenue dependency into a dollar exposure figure and put it in your risk register to get board-level accountability. |
| Speed of data is a competitive advantage | Brands with daily channel-margin visibility make better pricing, channel, and inventory decisions than those waiting on a monthly close. |
| Commerce Catalyst diagnostic as a starting point | The DTC Financial Health Assessment surfaces prioritized blind spots within two to four weeks, with clear ownership of next steps transferred to your team. |
The case for leading with financial clarity
The brands that sustain growth are not the ones with the best creative or the most engaged Instagram following. They are the ones where the founder has a clear, current read on where money is actually being made and lost, and can make decisions from that clarity rather than from a revenue trend line. Brand equity is real, and it is measurable. But it is built through consistent product quality, reliable customer experience, and the kind of long-term investment that only happens when cash is not perpetually being diverted to cover margin gaps that nobody has quantified.
What most founders underestimate is how quickly a financial blind spot becomes a brand problem. A cash crunch forces a packaging downgrade. A margin squeeze triggers a promotional calendar that trains customers to never pay full price. A platform concentration event cuts revenue by 30% in a quarter, and the response, cutting marketing, cutting service, cutting product development, is the exact sequence that erodes brand equity fastest. The financial event and the brand event are not separate. They are the same event, viewed from different angles.
The accountability question is worth naming directly: someone in your organization needs to own financial clarity as a weekly discipline, not a quarterly report. If that person does not exist yet, that is the first blind spot to close.
What Commerce Catalyst can do for your brand right now
Most founders who reach out to Commerce Catalyst already know something is wrong. Revenue is up, but cash is tight. Margins are compressing and nobody can explain exactly why. A fundraise conversation revealed that the financial story does not hold together under scrutiny. The diagnostic work starts from wherever you are.

The DTC Financial Health Assessment is a structured diagnostic that surfaces your highest-priority blind spots within two to four weeks. It covers channel-level margin analysis, order-level cost reconciliation, cash runway modeling, and a prioritized remediation plan with clear ownership. For founders who need faster impact, the 90-Day Profit Sprint adds implementation support alongside the diagnostic, with measurable margin improvement as the target outcome. For brands that need ongoing operational leadership embedded in the business, the fractional COO engagement builds the weekly cadence and accountability structure that prevents blind spots from re-forming.
To prepare for a productive first conversation, pull your last 90 days of channel-level revenue, your most recent cash flow statement, and your top five SKUs by revenue and margin. That data alone will shape the first hour of work. Book a discovery call at commercecatalyst.ai to get started.
Useful sources and further reading
- The Hidden Cost of Financial Blind Spots in Growing Businesses: Verexon Consultancy. Supports the claim that growth can mask structural weaknesses and delay costly corrections.
- Claire’s $690 Million Lesson: Why Financial Engineering and Brand Strategy Can’t Coexist: Smart Tech Invest. Illustrates how capital structure decisions and debt service can accelerate brand degradation and insolvency.
- Platform Algorithm Dependency Risk: A Board Guide: Influencers Time. Provides the framework for quantifying platform concentration as a dollar exposure and building it into a risk register.
- Why Liquidity Blind Spots Are a Strategic Liability: The Global Treasurer. Covers fragmented cash management and the avoidable financing costs it creates across subsidiaries and channels.
- The Blind Spot in Every Brand Budget: RDLB. Explains the gap between attribution dashboard metrics and fully loaded P&L, and why reconciling at the order level changes the picture.
- Most CPG Brands Can’t Answer a Simple Question: Are We Profitable Today?: Iris Finance. Supports the case for daily channel-margin visibility and the margin recovery potential it creates.
- Brand Is Not a Feeling. It’s a Financial Asset You’re Mismanaging.: Adotat. Covers the Kraft Heinz writedown and the argument that brand equity requires active financial investment to maintain.
- Brand Strategy and Risk Profile: Sciendo/GfK MIR. Academic grounding for the connection between brand architecture choices, cash flow volatility, and brand resilience.