
Price elasticity of demand measures how much your sales volume changes when you change your price: and for consumer brand managers, it is one of the most diagnostic numbers you are probably not tracking. A brand with low elasticity can raise prices without losing meaningful volume, protecting margin. A brand with high elasticity loses customers fast when prices climb, which means promotions feel necessary and pricing power erodes over time. Understanding where your SKUs sit on that spectrum is the first step toward making pricing decisions that actually improve profitability.
Table of Contents
- What is price elasticity of demand for consumer brands?
- What drives price sensitivity for your SKUs?
- How do you actually measure elasticity for your brand?
- How do you turn an elasticity number into a pricing decision?
- How do strong brands reduce price sensitivity over time?
- What do real consumer brand cases tell us?
- Key Takeaways
- What founders consistently get wrong about pricing
- Pricing power is something you can measure and build
- Useful sources and further reading
What is price elasticity of demand for consumer brands?
The formal definition is clear: price elasticity of demand is the percentage change in quantity demanded divided by the percentage change in price.
Formula: E = %ΔQ / %ΔP
Because demand almost always moves opposite to price, the result is negative. Economists typically report the absolute value. A result of |E| = 2 means a 1% price increase drives a 2% drop in volume. The sign convention matters less than what the number tells you about your revenue and margin exposure.
The three thresholds every brand manager needs:
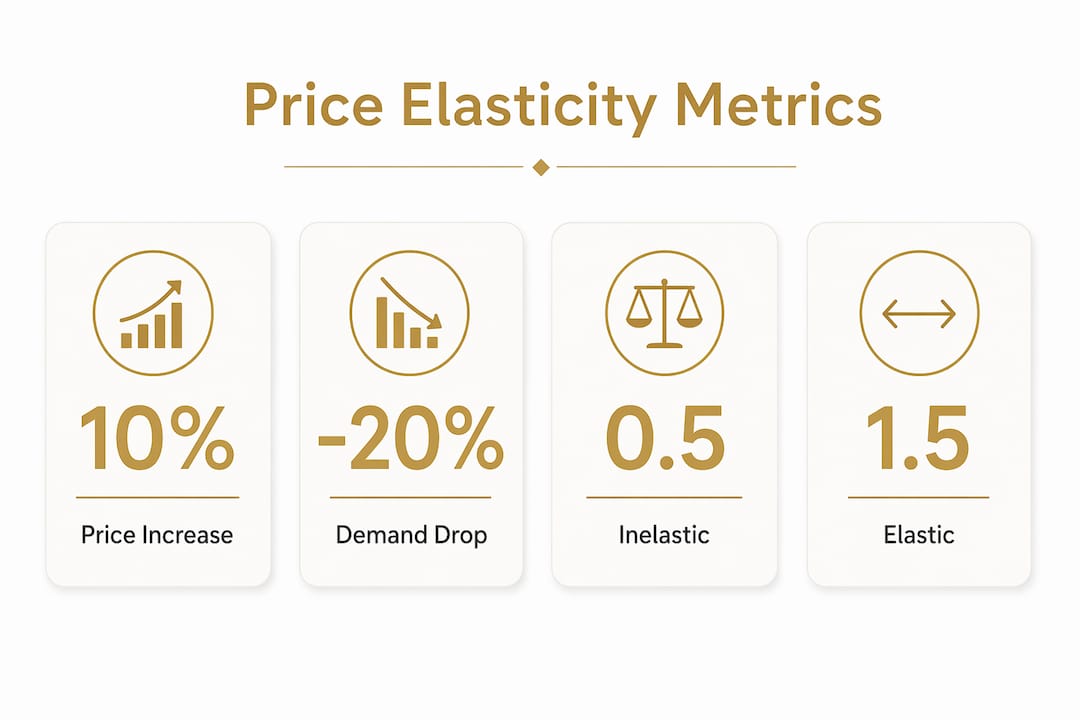
- Elastic demand (|E| > 1): Volume changes more than price. A price increase causes a proportionally larger drop in units. Total revenue falls. Discretionary goods, fashion, and categories with many substitutes often land here.
- Inelastic demand (|E| < 1): Volume changes less than price. A price increase causes a proportionally smaller drop in units. Total revenue rises. Necessities, habit-forming products, and strong branded goods tend to sit here.
- Unitary demand (|E| = 1): Volume and price move in exact proportion. Revenue stays flat regardless of direction.
Worked example: Suppose your skincare serum sells 1,000 units per month at $40. You raise the price to $44 (a 10% increase) and monthly volume drops to 850 units (a 15% drop). Elasticity = −15% / +10% = −1.5. That is elastic demand. Revenue before: $40,000. Revenue after: $37,400. The price increase cost you money.
Now consider a premium supplement brand that raises its capsule price 10% and sees only a 4% volume decline. Elasticity = −0.4. Inelastic. Revenue climbs, and if cost of goods is stable, margin expands.

Two consumer-brand contrasts illustrate this well. Commodity private-label products: store-brand paper towels, generic vitamins: sit at the elastic end because substitutes are abundant and brand perception is thin. Brands like Kylie Cosmetics or Prime, despite operating in crowded categories, have demonstrated inelastic demand at launch because brand affinity made them feel unique to their buyers. That perceived uniqueness is the mechanism worth building toward.
What drives price sensitivity for your SKUs?
Knowing the number is one thing. Knowing why your elasticity sits where it does is what lets you change it. Several structural factors determine how sensitive your buyers are to price changes.
-
Availability of substitutes. The more alternatives a buyer can easily find, the more elastic demand becomes. A commodity snack bar competes with dozens of near-identical options. A brand with a distinct formulation, flavor, or story faces fewer direct substitutes and commands more pricing power.
-
Necessity vs. discretionary. Products buyers need regularly: baby formula, prescription supplements, pet food: tend to be more inelastic. Discretionary purchases like premium candles or specialty beverages are more elastic because buyers can delay or skip without consequence.
-
Share of wallet. When a product represents a small fraction of a household’s monthly spend, price sensitivity is lower. A $4 price increase on a $12 product feels significant. The same increase on a $120 product barely registers.
-
Brand loyalty and perceived differentiation. Strong brand perceptions make functionally similar products feel unique, which directly reduces price sensitivity. This is not a soft concept: Kantar’s research shows that a one-point gain in pricing power can justify a four-point increase in relative price with smaller volume loss.
-
Purchase frequency. High-frequency repurchase categories (coffee, skincare, supplements) give buyers more opportunities to notice and react to price changes. Occasional purchases (a gift set, a seasonal product) are less scrutinized.
-
Switching costs. Subscription products, loyalty programs, and ecosystem lock-in all raise the cost of switching, reducing elasticity. A buyer who has auto-ship set up and a loyalty discount is less likely to defect over a modest price increase.
-
Time horizon. Short-run elasticity is almost always lower than long-run elasticity. Buyers need time to find substitutes, adjust habits, and act on their dissatisfaction. A price increase that looks safe in month one can erode volume steadily over a year as buyers quietly shift.
Pro Tip: Map your top three SKUs against each of these seven factors. Score each factor 1 (low sensitivity) to 3 (high sensitivity). Any SKU averaging above 2 deserves a controlled price test before a broad price increase: the risk of elastic demand is real and asymmetric.
How do you actually measure elasticity for your brand?
Most founders estimate elasticity loosely: they raise a price, watch sales, and draw a conclusion. That approach is unreliable because it confounds promotions, seasonality, and distribution changes with the true price effect. Here are the methods that actually work, ordered by rigor and data requirements.
Simple %ΔQ / %ΔP calculation is the fastest starting point. Pull two comparable periods with a known price difference, calculate the ratio, and you have a rough estimate. The problem: without controlling for promotions, seasonality, and distribution shifts, the number is often biased. Use it for directional orientation, not strategic decisions.
A/B price tests are the gold standard for DTC brands. Run two price points simultaneously across matched audience segments for 4–8 weeks. Control for traffic source, geography, and device. The result is a clean causal estimate of how price affects conversion and revenue. Minimum viable sample: roughly 500 transactions per price point to detect a meaningful effect with reasonable confidence.

Time-series regression uses historical sales data to isolate the price effect after controlling for seasonality, promotions, and other variables. This requires at least 12–18 months of clean weekly data with consistent promo flagging. It is more reliable than simple calculations and works well for wholesale or retail channels where A/B testing is impractical.
Promo-lift analysis works in reverse: measure how much volume spikes during a promotion, then infer elasticity from the lift magnitude. It is a useful proxy but tends to overstate elasticity because promotions attract deal-seekers who would not have bought at full price anyway.
Machine-learning elasticity models are increasingly accessible for brands with sufficient data. Platforms like o9 Solutions describe a shift toward AI-driven, real-time elasticity modeling that can estimate sensitivity at the SKU-by-channel-by-geography level. These models require clean, continuous transaction data and a stable product assortment to produce reliable outputs.
| Data Field | Why It Matters | Minimum Requirement |
|---|---|---|
| Date / week | Controls for seasonality and trends | 12–18 months for regression |
| Unit price (actual paid) | The independent variable | Every transaction |
| Units sold / conversion rate | The dependent variable | Every transaction |
| Promo flag | Separates organic demand from deal-driven spikes | All promotional periods flagged |
| Traffic / impressions | Controls for demand-side shifts | Weekly totals by channel |
| Channel | Elasticity differs by retail vs. DTC vs. Amazon | Separate by channel |
| Stockout flag | Prevents volume drops from being misread as price effects | Any out-of-stock period flagged |
Common pitfalls: Unflagged promotions are the most frequent source of bad elasticity estimates. A price increase that coincides with reduced ad spend will look more elastic than it is. A price decrease that coincides with a new retail listing will look more inelastic. Clean data hygiene before you run any model is non-negotiable.
Pro Tip: Before running a price test, freeze all other major variables: hold ad spend flat, avoid new retail launches, and flag any promotional activity. A four-week window with no confounders is worth more than six months of messy data.
How do you turn an elasticity number into a pricing decision?
The revenue logic is simple once you internalize it. For elastic goods (|E| > 1), a price increase reduces total revenue because the volume loss outweighs the per-unit gain. For inelastic goods (|E| < 1), a price increase raises total revenue because the volume loss is proportionally smaller. The margin implication goes further: if your cost of goods is fixed, an inelastic price increase drops almost entirely to gross profit.
Revisiting the worked example from earlier: the skincare serum with elasticity of −1.5 lost $2,600 in monthly revenue from a 10% price increase. The supplement brand with elasticity of −0.4 gained revenue and margin from the same move. Same price action, opposite outcomes: the difference is entirely in the elasticity.
When you are ready to roll out a price change, a structured approach reduces the risk of a misstep:
- Segment before you act. Elasticity varies by channel, customer cohort, and geography. Your DTC buyers may be far less price-sensitive than your Amazon buyers. Test in the channel where you have the most control first.
- Communicate the value, not the price. A price increase framed around a reformulation, new packaging, or added benefit lands differently than a silent shelf-price change. Buyers who understand why are less likely to defect.
- Move in increments. A 5% increase tested and confirmed is safer than a 15% increase assumed. Incremental moves also give you data points to refine your elasticity estimate over time.
- Monitor for 60–90 days post-change. Short-run elasticity understates long-run elasticity. A price increase that looks safe at 30 days may show volume erosion at 90 days as buyers find alternatives.
- Set a revenue and margin tripwire. Define in advance what volume decline triggers a rollback or a promotional response. Without a pre-set threshold, confirmation bias tends to delay corrective action.
For a deeper look at how to structure these decisions within a broader pricing framework, the sustainable profit pricing guide at Commerce Catalyst covers rollout checklists and price architecture in more detail.
How do strong brands reduce price sensitivity over time?
This is where pricing strategy and brand strategy converge. Elasticity is not a fixed property of your product. It is partly a function of how buyers perceive your brand relative to alternatives, and that perception is something you can actively shape.
Google Think’s analysis of brand investment and pricing power found that moving away from promotion-heavy communication toward balanced brand building can reduce price elasticity by up to 20%. In a simulated skincare case, marketing investment drove 76% of extra revenue when pricing was adjusted. The mechanism is clear: consistent brand advertising builds the kind of perceived uniqueness that makes buyers less willing to switch on price alone.
McCain’s experience is a concrete illustration. Sustained brand investment over nine years produced a 47% reduction in price elasticity, alongside meaningful gains in base sales. That is not a marginal improvement: it is a structural shift in how the brand competes.
| Lever | Mechanism | Expected Timeline |
|---|---|---|
| Consistent brand advertising | Builds perceived uniqueness, reduces substitutability | 12–18 months |
| Reducing promotion frequency | Trains buyers to expect full price, reduces deal-seeking | 6–12 months |
| Premium packaging / reformulation | Raises perceived value, shifts price corridor upward | 3–6 months |
| Price-pack architecture | Creates entry and premium tiers, segments price-sensitive buyers | 3–6 months |
| Product innovation | Adds functional differentiation, reduces direct comparisons | 6–18 months |
The promotion trap is worth naming directly. Aggressive discounting trains buyers to wait for deals, which increases measured elasticity over time. Shifting even a portion of that promotional budget toward brand-building advertising tends to reduce elasticity and improve base sales: a finding that Google Think’s research supports across multiple categories. The connection between marketing efficiency and brand profitability is one of the most underused levers in consumer brand strategy.
Pro Tip: Track your promotion-to-base-sales ratio quarterly. If more than 40% of your volume is moving on promotion, your elasticity is likely higher than your brand equity warrants: and you are training buyers to be price-sensitive.
A 90-day plan to start shifting elasticity:
- Audit your last 12 months of promotional activity and calculate what percentage of volume moved on deal.
- Identify one SKU where brand perception is strongest and run a 5% price test with no promotional offset.
- Shift a defined portion of promotional budget to brand-building content and measure base sales lift over 90 days.
- Map your brand against Kantar’s pricing power framework to identify whether you are underpriced relative to your equity.
- Set a quarterly brand health metric (aided awareness, purchase intent, or net promoter score) alongside your pricing KPIs.
For brands thinking about how brand strategy connects to pricing power and investor readiness, the relationship between brand equity and price corridor is one of the most direct paths to improved valuation multiples.
What do real consumer brand cases tell us?
Three short cases show how elasticity plays out in practice.
Case 1: Brand power absorbs a price increase. A premium personal care brand with strong DTC loyalty raised prices 12% across its hero SKUs after two years of consistent brand investment and minimal promotional activity. Volume declined roughly 3% in the first 60 days, then stabilized. The implied elasticity was well below 0.5. Gross margin expanded by several points. The brand’s investment in perceived differentiation had done the work before the price change was announced.
Case 2: A pricing error that eroded volume. A mid-market food brand raised prices 15% to offset input cost increases without any supporting brand communication or product update. Retail buyers noticed the shelf-price gap versus private label widened significantly. Volume dropped 22% over three months. The implied elasticity was above 1.4. The brand had assumed its distribution strength would protect volume: it did not, because buyers in that category had abundant substitutes and low switching costs.
Case 3: An experiment that revealed hidden elasticity. A supplement brand running frequent 20%-off promotions assumed its buyers were loyal. An A/B price test at full price with no promotional messaging showed conversion dropped 28% versus the promoted price. The brand had been training its buyers to be price-sensitive without realizing it. Shifting to a subscription model with a built-in discount reduced the apparent elasticity and stabilized revenue at a higher base price.
The common signal across all three: elasticity is not discovered at the moment of a price change. It is built or eroded over months and years of pricing and marketing decisions. Brands that monitor it proactively have far more room to maneuver. Exploring e-commerce pricing strategy types can help you identify which model fits your category and elasticity profile.
Key Takeaways
Price elasticity of demand is a measurable, manageable metric: and brands that actively track and shift it through consistent brand investment and disciplined pricing hold a durable margin advantage.
| Point | Details |
|---|---|
| Elasticity formula | Calculate as %ΔQ / %ΔP; values above 1 (absolute) signal elastic demand where price increases reduce revenue. |
| Seven demand drivers | Substitutes, necessity, share of wallet, brand loyalty, purchase frequency, switching costs, and time horizon all shape your SKU’s sensitivity. |
| Measurement discipline | A/B price tests require a sufficient number of transactions per price point; regression needs over a year of clean, promo-flagged data. |
| Brand investment reduces elasticity | Sustained brand advertising can reduce price elasticity by up to 20%, per Google Think analysis, while heavy promotions increase it over time. |
| Commerce Catalyst diagnostic | A pricing-power diagnostic maps your brand equity to price corridors and identifies which SKUs have room to raise price without volume loss. |
What founders consistently get wrong about pricing
The promotion paradox is equally damaging. Founders run promotions to protect volume, which trains buyers to wait for deals, which raises elasticity, which makes the next price increase riskier, which triggers more promotions. Breaking that cycle requires a deliberate shift: measure your promotion-to-base ratio, reduce deal frequency, and reinvest some of that budget in brand-building activity that actually moves perceived value. The brands that do this consistently are the ones that can raise prices without a crisis.
Pricing power is something you can measure and build
If you have read this far and are wondering whether your brand has pricing power or is quietly losing it, that question deserves a structured answer: not a gut check.

Commerce Catalyst’s DTC Financial Health Assessment is built for exactly this situation. It reviews your financials, pricing architecture, and promotional history to identify where elasticity is working against you and where you have room to raise price without volume risk. The output is a prioritized set of actions, not a report that sits in a folder. Founders typically come away with a clear view of which SKUs to test, which channels to move first, and what brand investments will shift their pricing power over the next 12 months. If you want a structured starting point, book a diagnostic and get a clear picture of where your pricing stands today.
Useful sources and further reading
- Price Elasticity of Demand Explained | St. Louis Fed: Accessible overview of elasticity mechanics with consumer-brand examples including influencer-driven brands. Good starting point for grounding the concept.
- Price Elasticity of Demand | Wikipedia: Comprehensive reference covering the formula, numeric thresholds, and empirical elasticity estimates across consumer categories including soft drinks, food, and medicine.
- Understanding Price Elasticity in Consumer Goods | Investopedia: Practical explanation of how product type, substitutes, and income share affect elasticity, with guidance on short-run vs. long-run differences.
- How to Make Pricing Work: The Business Case for Your Brand | Kantar: Research-backed framework for mapping brand equity to price corridors and understanding how pricing power translates to margin outcomes.
- Brand Equity and Pricing Power: Marketing’s Impact on Profitability | Google Think: Quantified analysis of how brand investment reduces price elasticity and drives base sales, including the McCain case and the skincare simulation.
- Where Next for Pricing in Consumer Goods? | o9 Solutions: Forward-looking overview of AI-driven elasticity modeling and dynamic pricing capabilities for consumer goods brands.
- DTC Financial Health Assessment | Commerce Catalyst: For founders who want a guided diagnostic that maps their brand’s pricing power and identifies which SKUs have room to move on price.
Recommended
- Consumer Brand Profitability Indicators: 2026 Guide | Commerce Catalyst
- Food & Beverage Brand Benchmarks 2026: CAC, Margins, LTV, Profitability | Commerce Catalyst
- Fashion & Apparel Brand Benchmarks 2026: CAC, Margins, LTV, Profitability | Commerce Catalyst
- Beauty & Skincare Brand Benchmarks 2026: CAC, Margins, LTV, Profitability | Commerce Catalyst