
A profitability diagnostic is a structured, segment-level financial assessment that identifies exactly where a business creates or destroys margin. It goes far beyond a standard profit and loss statement by breaking performance down across product lines, customer groups, sales channels, and geographic regions. Most founders discover that their aggregate profit figures hide significant variation. A business can show healthy overall margins while quietly bleeding cash in specific segments. Understanding what a profitability diagnostic reveals is the first step toward fixing what your income statement cannot show you.
What is a profitability diagnostic and how does it work?
A profitability diagnostic is defined as a granular financial assessment that moves beyond aggregate reporting to reveal profit leaks hidden within specific business segments. The standard P&L tells you what happened. A diagnostic tells you where and why.

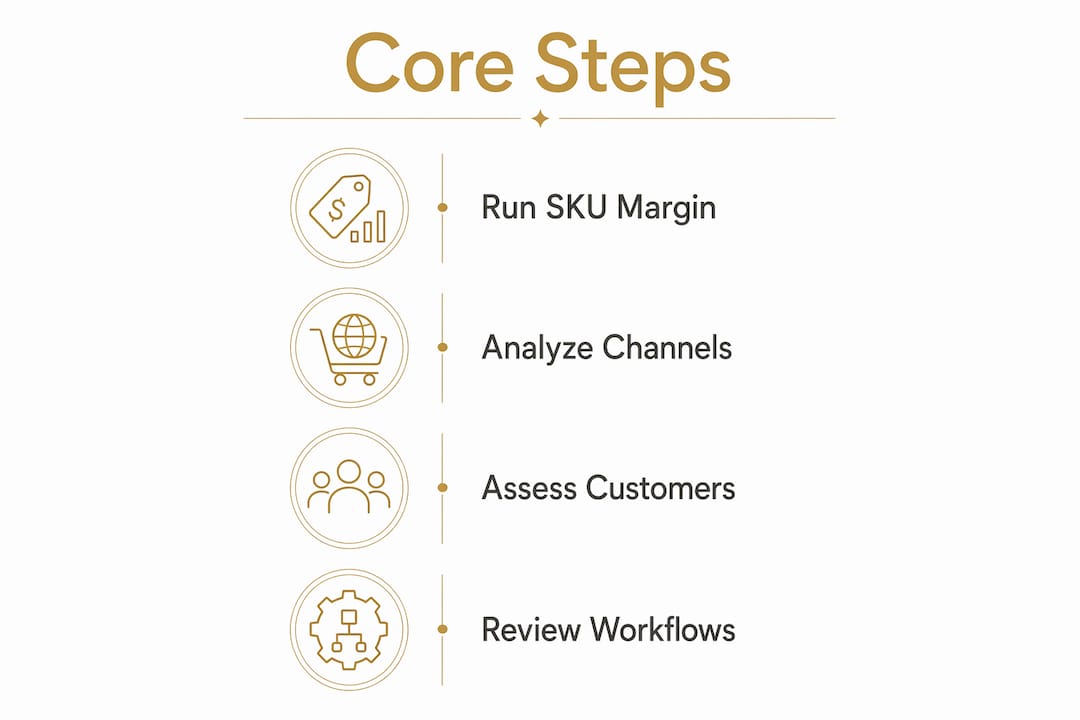
The process follows a clear sequence. First, you define the scope: which segments, time periods, and business units are under review. Second, you collect both operational and financial data, because the two must be read together to produce meaningful conclusions. Third, you allocate costs accurately to each segment, which is where most analyses go wrong. Fourth, you conduct root cause analysis on margin variances to separate structural problems from temporary noise.
The four core steps in practice
- Define scope and objectives. Decide whether you are analyzing product lines, customer cohorts, channels, or all three. Vague scope produces vague findings.
- Collect and integrate data. Pull revenue, cost of goods sold, fulfillment costs, and customer acquisition costs by segment. Operational data, including order volumes, return rates, and service hours, must accompany the financial data.
- Allocate costs with precision. Activity-based costing assigns indirect costs based on actual resource consumption rather than spreading them proportionally by revenue. This distinction changes conclusions dramatically.
- Translate findings into a tiered action plan. Effective diagnostics produce horizon-based plans: quick wins addressable within 30 days, medium-term improvements over one to three months, and structural upgrades for the longer term.
Pro Tip: Run gross margin by SKU before you run it by channel. Product-level margin is the fastest place to find a profit leak that your channel reporting will obscure.
Why is a profitability diagnostic critical for founders?
Aggregate profit figures mask significant variation, and diagnostics provide evidence that informs, but does not replace, strategic human judgment. That distinction matters. A diagnostic is a decision-support tool, not a decision-making machine.
The most common profit leaks stem from four sources: underpricing relative to true cost, uncontrolled indirect expenses, weak receivables policies, and poor monitoring of project costs. Each of these is invisible at the aggregate level. Each becomes obvious once you segment the data correctly.
The strategic benefits of a regular profitability assessment include:
- Better resource allocation. You stop funding segments that consume cash without returning margin.
- Pricing clarity. You see which products or customer groups are priced below their true cost to serve.
- Improved financial forecasting. Segment-level data produces more accurate forward projections than blended averages.
- Investor confidence. Founders who present segment-level margin data communicate financial discipline. Investors notice.
- Accountability culture. Diagnostics create shared language between finance and operations teams.
“A profitability diagnostic builds clarity and discipline without blaming people. It focuses on systemic issues that link operations and finances, giving leadership a factual basis for change rather than a list of culprits.”
Founders who skip the diagnostic phase often make the same mistake: they treat a revenue problem as a cost problem, or vice versa. The diagnostic separates the two. That clarity is what makes it a foundation for strategic decisions, not a substitute for them.
What segments does a profitability diagnostic analyze?
A profitability diagnostic can be applied to any unit of the business where revenue and costs can be meaningfully separated. The four most common segment types are product lines, customer groups, sales channels, and geographic regions. Each requires a different analytical lens.
| Segment type | Key metrics | Primary focus |
|---|---|---|
| Product lines | Gross margin per SKU, contribution margin | Cost of goods, pricing gaps |
| Customer groups | Revenue per customer, cost to serve | Service costs, lifetime value |
| Sales channels | Channel margin, fulfillment cost per order | Channel mix, fee structures |
| Geographic regions | Regional revenue, logistics cost | Distribution efficiency |
Customer profitability analysis requires deeper work than product analysis because it must account for the full cost of servicing a client, including support hours, return handling, and payment terms. A customer generating high revenue can still destroy margin if the cost to serve them is disproportionate. This is one of the most commonly overlooked profit leaks in DTC brands.
Channel analysis reveals a different problem. A brand selling across its own website, Amazon, and wholesale accounts will often find that one channel subsidizes another. The diagnostic quantifies that subsidy and forces a decision about whether it is intentional.
Pro Tip: When analyzing customer segments, calculate cost to serve separately from cost to acquire. Conflating the two hides the real margin profile of your best and worst customer cohorts.
Workflow and pricing model analysis rounds out the segment picture. Approval bottlenecks, rework loops, and collection delays all show up as margin erosion in the financial data. Linking operational workflows to financial outcomes is what separates a diagnostic from a standard financial review.
How can companies implement a profitability diagnostic effectively?
Effective implementation starts with a clear objective tied to a specific business question. “We want to understand our overall profitability” is not a useful objective. “We want to know which of our three product categories is destroying margin” is. Specificity drives the scope, and scope drives the quality of the output.
Successful diagnostics require clear objectives, integration of operational and financial data, and cross-functional team involvement. That last point is underrated. Finance teams alone cannot conduct a meaningful diagnostic because they lack the operational context to interpret cost variances. Operations teams alone cannot do it because they lack the financial framework. The two must work together.
Practical implementation steps for founders:
- Set the scope before touching the data. Define which segments, which time periods, and which cost categories are in scope.
- Audit your cost allocation method. Misallocation of indirect costs produces flawed conclusions. Revenue-based cost spreading is the most common error and the most dangerous.
- Integrate operational data. Pull return rates, fulfillment times, support ticket volumes, and order error rates alongside financial figures.
- Involve cross-functional teams. Operations, sales, and finance must all review findings before conclusions are drawn.
- Schedule periodic repeats. A one-time diagnostic is useful. A quarterly diagnostic is a management system. Periodic assessments enable continuous margin improvement and catch new leaks before they compound.
Pro Tip: Build your diagnostic template once, then reuse it quarterly. The first run takes the most time. Each subsequent run gets faster and more revealing because you are comparing against your own baseline.
The most common implementation failure is treating the diagnostic as a finance project rather than a leadership project. The findings must reach the people who control the behaviors driving the costs. Without that connection, the analysis produces a report that no one acts on.
Key Takeaways
A profitability diagnostic is the most direct tool a founder has for identifying where margin is created and where it is destroyed, segment by segment.
| Point | Details |
|---|---|
| Definition matters | A diagnostic assesses segment-level margin, not just aggregate profit or loss. |
| Cost allocation is critical | Activity-based costing produces accurate results; revenue-based spreading distorts them. |
| Segments reveal what P&Ls hide | Product, customer, channel, and regional analysis each expose different profit leaks. |
| Implementation needs cross-functional buy-in | Finance and operations must collaborate for findings to produce real change. |
| Repeat diagnostics build a management system | Quarterly assessments catch new leaks before they compound into structural problems. |
How Commerce Catalyst supports your profitability diagnostic
Commerce Catalyst works specifically with consumer brand founders who need segment-level financial clarity, not another generic financial report. The DTC Financial Health Assessment delivers a structured diagnostic across your product lines, customer cohorts, and channels, with findings translated into a prioritized margin recovery plan.

Chris Wichert brings founder experience to every engagement, which means the analysis connects operational realities to financial outcomes rather than stopping at the numbers. Founders also have access to fractional CFO support for ongoing diagnostic cycles and margin management. If you are ready to see exactly where your margin is going, the assessment is the right starting point.
FAQ
What is a profitability diagnostic in simple terms?
A profitability diagnostic is a structured financial assessment that breaks down business performance by segment, such as product, customer, or channel, to identify exactly where margin is created or lost. It goes beyond a standard P&L to reveal profit leaks that aggregate reporting cannot show.
How is a profitability diagnostic different from a P&L statement?
A P&L shows total revenue and costs across the business. A profitability diagnostic isolates performance by individual segment and links operational behaviors to financial outcomes, revealing which specific areas drive or destroy margin.
What are the most common profit leaks a diagnostic uncovers?
The most frequent sources are underpricing relative to true cost, uncontrolled indirect expenses, weak receivables policies, and poor monitoring of fulfillment or service costs. These are invisible at the aggregate level but clear once segment data is properly analyzed.
How often should a business run a profitability diagnostic?
Quarterly diagnostics function as a management system rather than a one-time exercise. Running them on a regular schedule allows founders to measure the impact of decisions and catch new margin leaks before they compound.
What is activity-based costing and why does it matter for diagnostics?
Activity-based costing allocates indirect costs based on actual resource consumption rather than spreading them proportionally by revenue. This method produces accurate segment-level profitability figures. Revenue-based cost distribution distorts results and leads to flawed strategic decisions.