
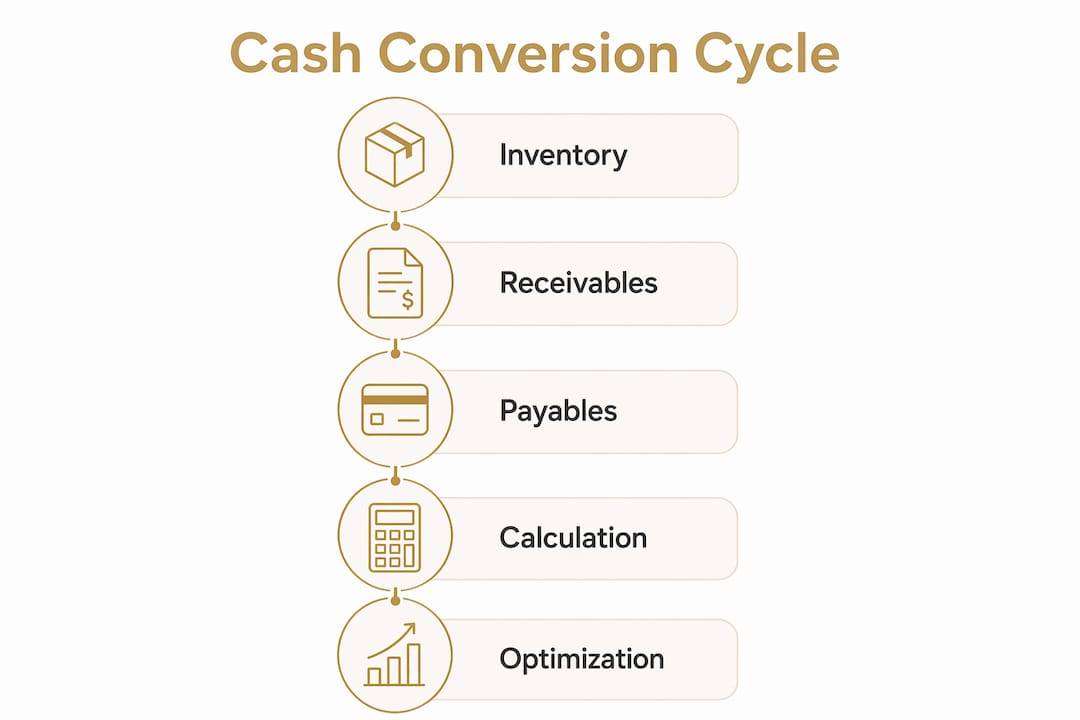
The cash conversion cycle (CCC) measures how many days your cash is tied up between paying for inventory and collecting from customers. The formula is clear: CCC = DIO + DSO − DPO, where DIO is Days Inventory Outstanding, DSO is Days Sales Outstanding, and DPO is Days Payable Outstanding. A shorter CCC means your business converts operational spending into cash faster, reducing the need for outside financing and freeing working capital for reinvestment. A longer CCC signals that cash is sitting idle in inventory or accounts receivable longer than it should be.
Three components drive every CCC result:
- DIO (Days Inventory Outstanding): how long inventory sits before it sells
- DSO (Days Sales Outstanding): how long it takes to collect cash after a sale
- DPO (Days Payable Outstanding): how long you take to pay your suppliers
Table of Contents
- What is the cash conversion cycle and how does each component work?
- How to calculate your CCC: a step-by-step worked example
- What counts as a good CCC, and what does a negative CCC mean?
- How to read CCC trends and spot the red flags
- Practical ways to shorten your cash conversion cycle
- When CCC isn’t the right metric to track
- Tools and templates for calculating and monitoring CCC
- The Commerce Catalyst founder checklist: 30, 90, and 180 days
- Key Takeaways
- The metric most founders misread
- How Commerce Catalyst helps you close the cash gap
- Useful sources
What is the cash conversion cycle and how does each component work?
Each of the three components has its own formula, and each one tells a different story about where cash gets stuck.
Days Inventory Outstanding (DIO)
DIO measures how long, on average, a unit of inventory sits on your shelf or in your warehouse before it sells. The formula is:
DIO = (Average Inventory ÷ COGS) × 365

Average inventory is typically the mean of your beginning and ending inventory balances for the period. COGS is cost of goods sold from your income statement. A high DIO means capital is locked in product that hasn’t moved yet, which is one of the most common cash drains for consumer brands carrying seasonal or trend-sensitive SKUs.
Days Sales Outstanding (DSO)
DSO captures the gap between making a sale and receiving the cash. For direct-to-consumer brands selling primarily through their own channels, DSO is often low because payment clears at checkout. For wholesale or B2B-facing brands, DSO can last several weeks to a few months depending on the payment terms extended to retail partners.

DSO = (Average Accounts Receivable ÷ Revenue) × 365
One practical note: strip out credit memos and returns from your receivables balance before calculating, or you’ll overstate DSO and misread your collections performance.
Days Payable Outstanding (DPO)
DPO reflects how long you hold onto cash before paying suppliers. A higher DPO is generally favorable for liquidity, but there’s a ceiling. Push it too far and you damage supplier relationships or lose access to early-pay discounts that could offset financing costs.
DPO = (Average Accounts Payable ÷ COGS) × 365
A few practical notes on data quality across all three:
- Use rolling 12-month (TTM) data when your business is seasonal; a single quarter can distort all three metrics significantly.
- For subscription or recurring-revenue models, consider substituting net revenue recognized in the period for gross billings in the DSO denominator.
- Reconcile your payables and receivables balances before calculating. Unreconciled entries are one of the most common sources of CCC miscalculation, and financial reporting errors compound the problem over time.
- If you report monthly, multiply by 30 instead of 365 for period-specific calculations, then annualize for comparisons.
How to calculate your CCC: a step-by-step worked example
The fastest way to understand the calculation is to run through a real set of numbers. Here’s a small consumer brand example with realistic inputs.
Input data
| Input | Value |
|---|---|
| Average Inventory | $480,000 |
| Cost of Goods Sold (COGS) | $2,400,000 |
| Average Accounts Receivable | $210,000 |
| Revenue | $3,600,000 |
| Average Accounts Payable | $320,000 |
Step-by-step calculation
- Calculate DIO: ($480,000 ÷ $2,400,000) × 365 = 73 days
- Calculate DSO: ($210,000 ÷ $3,600,000) × 365 = 21.3 days
- Calculate DPO: ($320,000 ÷ $2,400,000) × 365 = 48.7 days
- Calculate CCC: 73 + 21.3 − 48.7 = 45.6 days
This brand’s cash is tied up for roughly 46 days between paying for inventory and collecting from customers. Whether that’s healthy depends on the industry, but it’s a workable starting point for comparison.
To adapt this to monthly reporting, replace 365 with 30 in each formula. For quarterly analysis, use 90. When using TTM data, always pull the average balance across the full 12-month period rather than just the year-end snapshot, which can be distorted by seasonal inventory builds.
Downloadable template: Commerce Catalyst offers a pre-built Excel and CSV template that maps directly to this structure. It includes labeled input cells for each balance sheet and income statement line, auto-calculated DIO, DSO, and DPO, a rolling CCC chart, and a monthly trend table. You can request it through the DTC Financial Health Assessment page, where it’s included as part of the diagnostic toolkit.
What counts as a good CCC, and what does a negative CCC mean?
There’s no single “good” CCC number that applies across industries. Context matters more than the absolute figure.
For most product-based consumer brands, a CCC lasting from about one to three months is common. Apparel and fashion brands, which carry significant seasonal inventory risk, often run longer. Fast-moving consumer goods brands with strong retail distribution and tight supplier terms can operate with shorter cycles in the lower part of that range. You can benchmark your own brand against peers using category-specific data like fashion brand benchmarks or food and beverage benchmarks to get a more grounded comparison.
A few benchmarking principles worth keeping in mind:
- Compare your CCC to your own historical trend first. A rising CCC over three consecutive quarters is more telling than a single snapshot.
- Peer comparisons are most useful when the companies share similar business models, channel mix, and supplier structures.
- A CCC that’s improving while revenue is growing is a strong operational signal. A CCC that’s rising while revenue is flat usually points to a problem.
What a negative CCC actually means
A negative CCC occurs when a company collects from customers before it has to pay its suppliers. Think of a retailer that sells through its own e-commerce channel and collects payment at checkout, but has 60-day payment terms with its manufacturers. In that scenario, the business is essentially using supplier credit to fund operations, which can be a genuine competitive advantage. Amazon and large grocery chains have historically operated with negative CCCs for exactly this reason.
The risks are real, though. A negative CCC depends on maintaining reliable supplier relationships and consistent collection discipline. If either breaks down, the model unravels quickly. It’s also not replicable for most early-stage brands that lack the purchasing use to negotiate extended terms.
Asset-light service businesses, SaaS companies, and consulting firms often show a CCC near zero or negative by default, but the metric itself carries limited meaning for them. CCC is most useful for inventory-based businesses: retailers, wholesalers, and manufacturers where the physical movement of goods creates the cash timing gap.
How to read CCC trends and spot the red flags
A single CCC calculation is a snapshot. The real diagnostic value comes from tracking it over time and understanding what’s driving the movement.
A rising CCC typically points to one of three things: inventory is accumulating faster than it’s selling, customers are taking longer to pay, or supplier terms are tightening. The working capital cycle framework reinforces this: the goal is a steady, short cycle, and any sustained upward drift deserves investigation before it becomes a cash crisis.
A falling CCC is usually good news, but not always. If it’s driven by aggressive payables stretching, you may be trading short-term liquidity for supplier relationship risk. If it’s driven by faster inventory turns, that’s a genuine operational improvement worth sustaining.
A practical diagnostic approach:
- Verify data quality first. Reconcile AR and AP before drawing conclusions. Misclassified entries can make DSO look artificially high or DPO artificially low.
- Check for seasonality. A CCC spike in Q4 for a holiday-driven brand is expected. Compare the same quarter year-over-year rather than sequential quarters.
- Map the movement to your operations. Did you take on a large purchase order that inflated inventory? Did a major wholesale account pay late? Isolate the driver before prescribing a fix.
- Run a rolling 12-month chart. Stacking DIO, DSO, and DPO as separate trend lines reveals which component is moving and when the shift started.
Red flags that warrant immediate attention:
- DIO climbing more than 15 days over two consecutive quarters without a corresponding revenue increase
- A sudden DSO spike of 10+ days, especially concentrated in one or two accounts
- DPO dropping sharply, which may indicate you’re paying early without capturing discounts or that your payables process lacks a payment schedule
- CCC rising while gross margin is compressing simultaneously, which often signals a deeper cash flow problem that revenue growth alone won’t solve
Practical ways to shorten your cash conversion cycle
Improving CCC comes down to three levers: move inventory faster, collect receivables sooner, and pay suppliers on a disciplined schedule. The sequencing matters as much as the tactics.
Inventory tactics
- Demand forecasting: Use trailing sales data and forward-looking signals (promotions, seasonality, channel mix) to right-size purchase orders. Overbuying is the single largest driver of elevated DIO for consumer brands.
- SKU rationalization: Identify your bottom-performing 20% of SKUs by contribution margin and velocity. Slow-moving SKUs tie up cash and inflate DIO without proportional revenue return. The unprofitable revenue streams diagnostic is a useful framework for this analysis.
- Safety-stock reduction: Audit your reorder points. Many brands carry safety stock calibrated to worst-case scenarios that rarely materialize.
- Drop-shipping and consignment: For new product launches or low-velocity SKUs, consider consignment arrangements with suppliers or drop-ship models that defer inventory ownership until the point of sale.
Receivables tactics
Faster invoicing is the lowest-effort DSO lever available. Sending invoices the same day goods ship, rather than at month-end, can shorten collection timelines materially. Pair that with clear payment terms on every invoice and automated reminders for overdue balances.
Automated dunning for overdue invoices and improved billing accuracy are among the most reliable ways to shorten DSO. Disputes that delay payment are often caused by invoice errors, not customer unwillingness to pay, so billing accuracy is worth auditing before you escalate collections.
Other receivables levers:
- Offer early-pay discounts selectively (e.g., 2/10 net 30) for wholesale accounts where the discount cost is lower than your cost of capital.
- Tighten credit terms for new accounts or accounts with a history of late payment.
- Review your dispute resolution workflow. Unresolved disputes sit in AR indefinitely and inflate DSO without representing real collection risk.
Payables tactics
The goal with DPO is not to stretch it as far as possible. It’s to pay on a predictable, disciplined schedule that preserves supplier relationships while keeping cash in your account as long as legitimately possible. Batching payments into weekly or biweekly cycles, rather than paying invoices as they arrive, is one of the simplest operational changes a founder can make. It improves DPO without requiring any renegotiation.
For larger supplier relationships, incremental term negotiation is safer than a one-time push for extended terms. A move from net 30 to net 45 is far easier to sustain than a jump to net 90, and it doesn’t create the adversarial dynamic that can disrupt supply continuity.
Pro Tip: Prioritize process fixes and automation before renegotiating supplier terms. Operational improvements to accounts payable and receivable processes can improve those balances by 30% or more in a matter of weeks for companies beginning a cash improvement effort. That kind of early momentum is easier to build than a complex supplier negotiation and carries far less relationship risk.
Trade-off to keep in mind: every lever has a cost. Tighter credit terms reduce DSO but can push customers to competitors. Aggressive payables stretching improves DPO but risks supply disruptions. Balancing improvements across all three components, rather than maximizing any single one, produces more durable results.
When CCC isn’t the right metric to track
CCC is a powerful tool for the right business model. For others, it can actively mislead.
Asset-light service businesses: SaaS companies, consulting firms, insurance providers, and pure service businesses: have little or no inventory. Their CCC is either near zero by default or structurally meaningless because the formula’s inputs don’t reflect how the business actually generates and consumes cash. Applying CCC to a software company and concluding it’s “efficient” misses the point entirely.
Business types where CCC has limited diagnostic value:
- SaaS and subscription software: Revenue is recognized over time, not tied to physical goods. Track cash runway, monthly recurring revenue, and gross burn instead.
- Consulting and professional services: No inventory, minimal receivables lag for retainer-based work. Net revenue retention and days to invoice are more relevant.
- Insurance: Cash flow is driven by premium collection and claims timing, not inventory cycles.
- Marketplace and platform businesses: The platform itself doesn’t hold inventory; seller-side metrics are more relevant than a consolidated CCC.
For service firms that do carry some receivables, a modified DSO calculation using revenue in the denominator can still be useful for tracking collections performance. But the full CCC formula adds little when DIO is structurally zero.
If your business doesn’t fit the inventory-based model, focus on cash runway (months of operating expenses covered by current cash), gross burn rate, and cohort-based receivables aging. These metrics give a more honest picture of why cash runs short in asset-light models.
Tools and templates for calculating and monitoring CCC
The calculation itself is simple enough to run in a basic spreadsheet. The challenge is building a system that keeps it current without requiring manual effort every month.
The downloadable template
Commerce Catalyst’s CCC template includes pre-labeled input cells for average inventory, COGS, average receivables, revenue, and average payables. It auto-calculates DIO, DSO, DPO, and the full CCC, and includes a rolling 12-month trend chart and a monthly data entry table. To access it, visit the DTC Financial Health Assessment page. The template is designed to work with data exported directly from QuickBooks, Xero, or any accounting system that produces a standard balance sheet and income statement.
Automation options
For brands running on an ERP or a more sophisticated accounting platform, CCC can be calculated automatically from live data:
- QuickBooks Online and Xero both support custom report exports that feed directly into a CCC spreadsheet model. Neither calculates CCC natively, but the required inputs are available in standard reports.
- NetSuite and similar mid-market ERPs can be configured to surface DIO, DSO, and DPO as dashboard KPIs, pulling from live inventory and AR/AP ledgers.
- Fathom, Spotlight Reporting, and similar financial reporting tools connect to accounting systems and can display CCC trend charts alongside other working-capital metrics.
Monitoring frequency and alert thresholds
For most consumer brands, monthly CCC tracking is sufficient. Daily monitoring makes sense only if you’re in an active cash crisis or managing a high-velocity inventory model. Set alert thresholds based on your historical baseline: if CCC rises more than 10 days above your trailing 6-month average, that’s a signal worth investigating before it compounds. Cash flow management basics for small businesses reinforce the same principle: consistent monitoring beats reactive firefighting every time.
Free spreadsheet models are adequate for most brands under $10M in revenue. Above that threshold, the time cost of manual updates usually justifies a reporting tool that automates the data pull.
The Commerce Catalyst founder checklist: 30, 90, and 180 days
This checklist is designed for consumer brand founders who want a prioritized sequence of actions, not a generic list of best practices. The timeline reflects realistic implementation effort, not theoretical speed.
30-day quick wins
These require no capital, no vendor negotiation, and no new software. They’re process fixes that most brands can execute immediately.
- Reconcile all open AR and AP balances. Identify any invoices older than 60 days that haven’t been followed up on.
- Set up a weekly payment batch. Stop paying invoices as they arrive and move to a Tuesday or Wednesday payment run.
- Audit your invoicing process. If invoices go out at month-end rather than at the point of shipment, fix that immediately.
- Stop making early payments unless you’re capturing a discount that exceeds your cost of capital.
- Pull your current DIO, DSO, and DPO using the template above. Establish your baseline before making any other changes.
90-day tactical moves
| Action | Expected CCC Impact | Owner |
|---|---|---|
| SKU rationalization: cut bottom 20% by velocity | DIO reduction of about two weeks | Founder + Merchandising |
| Automated dunning for invoices 15+ days overdue | DSO reduction of 3–10 days | Finance Lead |
| Renegotiate terms with top 3 suppliers | DPO improvement of about two weeks | Founder |
| Implement demand-based reorder points | DIO reduction of 5–10 days | Operations |
| Tighten credit terms for new wholesale accounts | DSO reduction of 5–10 days | Finance Lead |
180-day strategic fixes
At this stage, you’re building systems, not just fixing processes. The focus shifts to demand forecasting infrastructure, working-capital KPIs embedded in your operating cadence, and vendor financing options for larger purchase orders.
- Build or buy a demand-forecasting model that uses trailing sell-through data, promotional calendars, and channel mix to drive purchase orders.
- Establish a monthly working-capital review: CCC, cash runway, and gross burn as standing agenda items in your finance review.
- Explore supplier financing or inventory financing facilities for high-velocity SKUs where purchase order timing creates cash gaps.
- If operational restructuring is needed (warehouse layout, 3PL changes, fulfillment model shifts), this is the phase to scope and execute it.
When to bring in outside help: If your initial 30-day fixes don’t move the needle, or if vendor negotiations require structural changes to your supply agreements, or if your CCC is rising despite process improvements, that’s the signal to engage advisory support. Shorter CCCs free cash for strategic investments and reduce borrowing costs, but getting there often requires an outside perspective on where the real constraint sits. The DTC Operator Diagnostic is designed specifically for that moment.
Key Takeaways
The cash conversion cycle is the single most direct measure of how efficiently your business converts operational spending into cash, and shortening it is almost always the fastest path to improved liquidity without raising capital.
| Point | Details |
|---|---|
| CCC formula | CCC = DIO + DSO − DPO; measures days between paying for inventory and collecting from customers. |
| Shorter is better | A shorter CCC reduces external financing needs and frees working capital for reinvestment. |
| Negative CCC is possible | Collecting before paying suppliers creates a negative CCC, a potential advantage but not universally sustainable. |
| Process fixes move the needle fast | Operational improvements to AR and AP processes can improve those balances significantly within weeks. |
| Commerce Catalyst checklist | The 30/90/180-day founder checklist sequences quick wins before structural fixes, with advisory support for complex cases. |
The metric most founders misread
The pattern is consistent: a brand hits a growth phase, places larger purchase orders to meet demand, extends credit terms to land a major retail account, and suddenly finds itself cash-constrained despite strong top-line numbers. Profit doesn’t equal cash, and CCC is the clearest lens for seeing exactly where the gap opens up.
The other thing worth saying plainly: CCC improvement is not a one-time project. The brands that sustain it build it into their operating rhythm, the same way they track gross margin or ad spend. When it becomes a standing metric in your monthly review, it stops being a diagnostic tool and starts being a management tool. That’s when it actually changes how decisions get made.
How Commerce Catalyst helps you close the cash gap
Knowing your CCC is one thing. Knowing which lever to pull first, and how hard, is where most founders get stuck. Commerce Catalyst works directly with consumer brand founders to translate the numbers into a prioritized action plan, whether that’s a one-time financial health assessment that maps your current CCC and identifies the highest-impact fixes, or an ongoing fractional COO engagement that runs the operational changes alongside your team.

The diagnostic process starts with your actual financials, not a generic framework. You get a clear picture of where cash is getting stuck, a ranked list of fixes by effort and impact, and a roadmap you can execute with your existing team or with hands-on support. For founders who’ve already tried the obvious fixes and are still watching CCC climb, the DTC Financial Health Assessment is the right starting point.
Useful sources
The following sources informed this article and offer further reading for founders who want to go deeper on specific aspects of cash conversion and working-capital management.
- FDIC: Managing Cash Flows Participant Guide: A foundational, plain-language explanation of the CCC formula and its three components, published by the Federal Deposit Insurance Corporation as part of its small-business financial education series.
- J.P. Morgan: Understanding and improving Your Cash Conversion Cycle: Covers the relationship between CCC, working capital, and financing costs, with practical guidance on improvement from J.P. Morgan’s treasury and receivables practice.
- Ripple Treasury: What Is a Cash Conversion Cycle?: A practitioner-focused explainer on the CCC formula, component balancing, and tactical recommendations for shortening the cycle.
- McKinsey: Gain Transformation Momentum Early by improving Working Capital: Research-backed guidance on the impact of operational process improvements on AR and AP balances, including the 30%+ improvement estimate cited in this article.
- GuruFocus: Cash Conversion Cycle Definition, Formula & Calculator: Useful for benchmarking CCC across public companies by industry, and for understanding when CCC is and isn’t an appropriate metric.
- Wikipedia: Cash Conversion Cycle: A reliable reference for the formula, component definitions, and the mechanics of negative CCC, with links to related working-capital concepts.
- Stripe: Working Capital Cycle: Explains the broader working-capital cycle framework and the importance of monitoring and maintaining short, steady cycles.
- Harvard Business School Online: Word of the Week: Cash Conversion Cycle: A concise, authoritative definition from HBS Online, useful as a reference point for the academic framing of the metric.
Recommended
- Why Profit Doesn’t Equal Cash: A Founder’s Guide | Commerce Catalyst
- Working Capital for Startups: A 2026 Growth Guide | Commerce Catalyst
- Food & Beverage Brand Benchmarks 2026: CAC, Margins, LTV, Profitability | Commerce Catalyst
- Fashion & Apparel Brand Benchmarks 2026: CAC, Margins, LTV, Profitability | Commerce Catalyst