
Channel profitability measures the net financial return a business earns from each sales or distribution channel after deducting every associated cost, both direct and indirect. It answers a question that top-line revenue never can: which channels are actually making you money, and which ones are quietly destroying margin?
Most founders track revenue by channel. Far fewer track true profit by channel. That gap is where bad decisions live.

What does channel profitability mean, exactly?
Channel profitability is the net financial return from a sales or distribution channel after subtracting all costs required to operate it. It goes well beyond gross margin, capturing the full economic contribution of each channel to the business.
The channels this applies to include:
- E-commerce / DTC (your own Shopify or website)
- Online marketplaces (Amazon, Walmart Marketplace, eBay)
- Retail and wholesale (brick-and-mortar, regional chains, national accounts)
- Distributors (third-party distribution networks)
- Direct sales (field reps, inside sales teams, B2B accounts)
The critical distinction is between revenue tracking and true profitability measurement. A channel generating $2M in revenue but consuming $1.9M in total costs is not a growth engine. It is a liability dressed up as traction. Understanding channel profitability means refusing to let gross margin be the final word.
How to calculate channel profitability accurately

The calculation starts with channel revenue, then strips away costs in layers until you reach a number that reflects genuine economic reality.
The core formula:
Channel Profit = Channel Revenue − Channel COGS − Channel-Specific Costs − Allocated Demand Gen − Channel Conflict Opportunity Cost
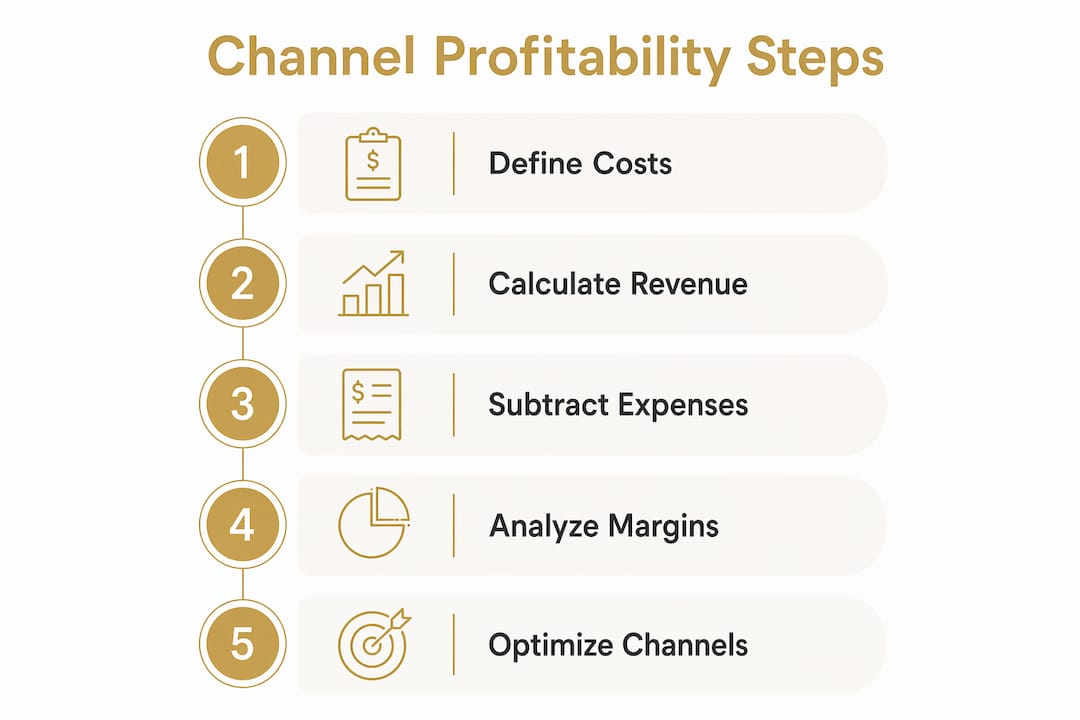
The steps, in order:
- Start with channel revenue. Total sales attributed to that channel in the period.
- Subtract channel-specific COGS. Different channels often require different packaging, minimum order quantities, or product configurations.
- Subtract channel-specific cost-to-serve. This includes fulfillment fees, marketplace commissions, payment processing, returns handling, and customer service costs tied to that channel.
- Subtract variable marketing spend. Ad spend, influencer fees, and promotional costs attributed by channel belong here, not in a blended marketing line.
- Allocate shared overhead. Technology, management time, and facilities costs should be distributed across channels based on usage or revenue share.
| Cost Layer | What It Includes | Common Mistakes |
|---|---|---|
| Channel COGS | Packaging, MOQs, channel-specific terms | Using blended COGS across all channels |
| Cost-to-serve | Fulfillment, fees, returns, payment processing | Ignoring returns rate differences by channel |
| Variable marketing | Attributed ad spend, CAC by channel | Pooling all marketing into one overhead line |
| Shared overhead | Tech, management, facilities | Skipping allocation entirely |
The most common mistake is stopping at gross margin. Marketplace channels like Amazon often show attractive gross margins until you load the commission, advertising costs to maintain visibility, and a returns rate that frequently runs higher than DTC. What looked like a profitable channel can turn negative fast.
Key factors that drive channel profitability up or down
Several forces shape whether a channel generates real profit or just revenue.
- Pricing strategy and gross margin by channel. Wholesale channels typically require 40–50% margin give-up. That is not inherently bad, but it must be modeled explicitly, not absorbed into blended averages.
- Customer acquisition cost (CAC). DTC channels often carry high gross margins but require you to pay full CAC. Retail channels effectively transfer that cost to the retailer. A DTC channel with 70% gross margin and a $40 CAC on a $50 product is barely profitable.
- Marketplace commissions and returns. Marketplace commissions typically run 15–30% of revenue, and returns processing adds further cost. These costs destroy contribution margin in categories with high return rates.
- Channel conflict and opportunity cost. Opening DTC while maintaining wholesale can cause wholesale partners to reduce orders or demand better terms. That revenue shift is a real cost, and it rarely appears in a standard P&L. Ignoring it overestimates profitability across both channels.
- Inventory and operational complexity. Each new channel adds SKU configurations, pricing parity requirements, and operational overhead. Companies expanding from one channel to five typically add 3–5% to OPEX in complexity costs alone.
- Marketing efficiency. Poor attribution of demand-generation spending inflates the apparent profitability of channels that benefit from shared marketing investment without bearing its cost.
Pro Tip: Before adding a new channel, model the full cost-to-serve including returns, fulfillment, and the opportunity cost of channel conflict. Revenue growth that adds negative contribution margin is not growth. It is dilution.
How channel profitability shapes financial planning and strategy
Channel profitability analysis is one of the most direct inputs into resource allocation decisions a founder or CFO makes. It tells you where to put the next dollar of marketing spend, which channels deserve headcount, and which ones need to be restructured or exited.
The strategic uses go beyond cost-cutting:
- Budget prioritization. Channels with strong contribution margins justify higher marketing investment. Channels with thin or negative margins should receive constrained budgets until the economics improve.
- Channel expansion and exit decisions. A channel generating negative channel profit after overhead allocation is a candidate for exit or significant restructuring, not incremental investment.
- Working capital management. Retail channels often tie up more working capital in inventory than DTC. Sorting channels by margin per dollar invested, not just margin per revenue dollar, frequently reveals a channel mix you did not expect.
- First-party data value. DTC channels sometimes justify lower short-term profitability because they generate first-party customer data that retail cannot provide. That strategic value belongs in the analysis, but it needs a defined investment horizon and a clear path to profitability.
- Aligning channel mix with growth targets. Procter & Gamble drives channel mix decisions through detailed channel P&Ls per retail customer and per channel format. Their decision to prioritize club channels for certain SKUs reflects P&L analysis showing better profit per case despite lower per-unit pricing.
Understanding channel profitability also directly influences liquidity and working capital management, since different channels carry different payment terms, inventory requirements, and cash conversion cycles.
Analytical techniques that give you a real picture
The most rigorous practitioners use a multi-tier waterfall analysis that builds from gross margin down to fully loaded channel profit. Each tier answers a different question.
| Tier | What It Measures | Decision It Drives |
|---|---|---|
| CM1 (Gross Profit) | Revenue minus COGS | Product pricing and sourcing |
| CM2 (Post-Fulfillment) | CM1 minus channel variable costs | Channel fee negotiation, fulfillment model |
| CM3 (Post-Marketing) | CM2 minus attributed marketing spend | Ad budget allocation, CAC targets |
| Channel Profit | CM3 minus allocated shared overhead | Channel investment, expansion, or exit |
The distinction between CM3 and channel profit is one that many operators miss. CM3 tells you whether a channel covers its direct operating costs. Channel profit tells you whether it creates net value after absorbing its share of the infrastructure that makes the whole business run. Both numbers are necessary, but they answer different questions and drive different decisions.
Activity-based costing strengthens this analysis by assigning shared costs based on actual resource consumption rather than arbitrary revenue splits. When you combine channel P&L discipline with proper overhead allocation, you get a picture that blended reporting simply cannot provide.
Common analytical traps to avoid:
- Allocation errors that penalize high-volume channels unfairly
- Ignoring channel conflict costs entirely
- Measuring only margin per revenue dollar without measuring margin per dollar of working capital invested
- Treating a channel’s CM3 as its final profitability number
A direct-to-consumer apparel brand that added Amazon as a third channel discovered, after a period of time, that Amazon represented a significant portion of revenue but generated a negative contribution margin once commissions, advertising spend, and a higher returns rate were fully loaded. The disciplined response was curation: reducing the Amazon SKU count and pulling back advertising. Revenue dropped, but contribution profit grew.
What you need to remember about channel profitability
Channel profitability is the financial discipline that separates brands that scale sustainably from those that grow revenue while quietly eroding margin. The core insight is simple: revenue by channel tells you where customers are buying. Profit by channel tells you where the business is actually winning.
Key concepts to carry forward:
- Channel profitability = net return after all costs, not gross margin and not revenue.
- The waterfall matters. CM1, CM2, CM3, and fully loaded channel profit each answer a different operational or strategic question.
- Indirect costs are where the surprises live. Marketplace commissions, returns processing, channel conflict costs, and allocated overhead routinely flip a channel from apparent profitability to actual loss.
- Working capital is a dimension of profitability. Sort channels by margin per dollar of capital invested, not just margin per dollar of revenue.
- Strategic value has a time limit. A channel justified by first-party data or market presence needs a defined profitability timeline, not an open-ended investment horizon.
For founders building toward a profitability roadmap, channel P&L analysis is the foundation. Without it, you are making channel mix decisions on incomplete information. With it, you can allocate capital, marketing spend, and headcount with genuine confidence.
How Commerce Catalyst approaches channel profitability
Chris Wichert built Commerce Catalyst from direct experience as a consumer brand founder, which means the channel profitability work he does with clients is grounded in the real pressures of scaling a business, not just financial theory.
The distinction between CM3 and fully loaded channel profit is one Chris applies consistently in client diagnostics. CM3 is the operational number: it tells you whether a channel justifies its direct costs and what your ad spend ceiling should be. Channel profit is the strategic number: it tells you whether the channel deserves continued investment, headcount, or an exit conversation.
Real-world channel analysis through Commerce Catalyst often surfaces costs that founders have never modeled explicitly. Marketplace channels are a frequent example. The headline commission rate looks manageable. The advertising required to maintain visibility, the elevated returns rate, and the allocated overhead rarely appear in the same line of the same report until a proper channel P&L forces them together.
Pro Tip: If your marketplace channel looks profitable at gross margin but you have never built a full channel P&L, you almost certainly do not know whether it is actually profitable. The gap between gross margin and fully loaded channel profit in marketplace channels is routinely larger than founders expect.
Commerce Catalyst’s DTC financial health assessment is built specifically to surface these gaps. The diagnostic maps each channel’s revenue, cost-to-serve, marketing attribution, and overhead allocation into a single view, so the decisions about where to invest, where to pull back, and where to exit are driven by real numbers rather than blended averages.
For founders who want to build channel profitability analysis into their ongoing financial practice, the starting point is always the same: build the channel P&L before you make the next channel decision, not after.

Key Takeaways
Channel profitability requires measuring net return per channel after all direct and indirect costs, not just gross margin or revenue.
| Point | Details |
|---|---|
| Definition of channel profitability | Net financial return per channel after subtracting COGS, cost-to-serve, marketing, and allocated overhead. |
| The waterfall framework | CM1, CM2, CM3, and channel profit each drive different operational and strategic decisions. |
| Marketplace cost reality | Commissions, advertising to stay visible, and higher returns rates routinely flip apparent margin to actual loss. |
| Working capital dimension | Sort channels by margin per dollar of capital invested, not only by margin per revenue dollar. |
| Strategic vs. operational numbers | CM3 drives spending decisions; fully loaded channel profit drives investment, headcount, and exit decisions. |