A Weekly Business Review is a 45 to 60 minute, decision-first leadership meeting that converts a one-page pre-read into named actions and weekly commitments. It runs on trend data, not status updates, and its output is a short list of owned, dated actions rather than a recap of what happened. The recommended cadence: same time, same day, every week, with a pre-read circulated 24 hours in advance so the room is used for judgment, not narration.
TL;DR:
- A successful weekly business review focuses on input metrics controllable by owners rather than lagging outputs like revenue or orders.
- Trend analysis should show six-week and 12-month views to detect short-term drift and seasonal patterns, using charts instead of static numbers.
- Each action assigned must have a clear owner and due date to transform discussions into commitments rather than wishful thinking.
- The review process should emphasize checking prior-week actions first, then analyzing flagged anomalies, to reinforce accountability and decision-making.
- Regularly refining metrics to match current business constraints and avoiding overload ensures the WBR remains impactful and time-efficient.
Table of Contents
- What Is a Weekly Business Review, and Why Does It Matter?
- The Four Mechanisms That Make a WBR Actually Work
- How Do You Choose Which Metrics to Track?
- Building the 60-Minute Agenda: A Runbook You Can Copy
- How Do You Keep a WBR Focused on Decisions, Not Discussion?
- Tools and Templates That Keep the Process Sustainable
- Common Pitfalls That Kill a WBR (and How to Fix Them)
- How Commerce Catalyst Applies WBR Mechanics to DTC Brands
- Tailoring the WBR to Different Functions and Industries
- What Do Successful WBR Formats Actually Look Like?
- Making the WBR Better Every Quarter
- A Founder Advisor’s View on Protecting the Weekly Rhythm
- How Commerce Catalyst Can Help You Build This
- Sources
What Is a Weekly Business Review, and Why Does It Matter?
Most leadership meetings drift into status theater. Someone reads a slide. Someone nods. Nobody leaves with a different set of priorities than they walked in with. A properly run weekly business review is built to prevent exactly that. The format, popularized by Amazon’s operating cadence and now widely adopted across DTC and SaaS leadership teams, is typically a structured 45 to 60 minute meeting focused on tracking performance, catching anomalies early, and assigning outcomes someone is actually accountable for.
The distinction that matters most: a status meeting reports what happened. A WBR decides what happens next. If your current weekly sync is mostly people reading numbers off a screen while everyone else waits their turn, you don’t have a WBR. You have a recap with a calendar invite.
A WBR earns its place on the calendar by chasing four things at once. First, it detects drift, catching a metric that’s sliding before it becomes a quarter-defining problem. Second, it forces decisions, turning “we should look into that” into an actual choice with a name attached. Third, it assigns actions, so the meeting produces work rather than just discussion. Fourth, it accelerates learning, because a team that reviews trends weekly builds pattern recognition that a monthly or quarterly cadence simply can’t match.
Who needs to be in the room depends on what’s being reviewed. For a founder-led company under roughly $10 million in revenue, that’s usually the founder plus the two or three people who own the biggest levers: marketing, operations, and finance. Past that stage, the meeting typically scales to functional leads or department heads, each owning a slice of the scorecard. Sales reps, individual marketers, and junior operators don’t belong in the room. Their managers do.
Duration matters more than most leaders assume. Short meetings rarely allow for real discussion of anomalies. Very long meetings often signal agenda or pre-read issues. Most leadership teams find that meetings between about 45 and 60 minutes work well to cover necessary topics and decisions. This isn’t a rule to be exact about. It’s a range to notice when you’ve drifted outside.
The Four Mechanisms That Make a WBR Actually Work
A WBR isn’t valuable because it happens weekly. It’s valuable because of four specific mechanisms working together. Strip any one out and the meeting degrades back into status theater within a month.
Input metrics get priority over lagging outputs. Revenue, gross margin, and total orders are outputs. They tell you what already happened, but they don’t tell anyone what to do differently this week. Input metrics, like conversion rate, cost per acquisition, email open rate, or fulfillment cycle time, are the levers a team can actually pull. A productive review runs on four connected mechanisms: input metric focus, trend analysis, explicit action assignment, and prior-week accountability. Miss the input focus and every conversation turns into explaining a number nobody can influence in the next seven days.
Trend analysis replaces single-point snapshots. A metric read in isolation tells you almost nothing. You can’t know from one data point. The fix is showing every core metric as a time series: a six-week rolling view to catch short-term drift, alongside a 12-month view to catch seasonality and year-over-year comparisons. Present a chart, not a cell.
Every action needs a name and a date attached to it. “We’ll look into the shipping delays” is not an action. It’s a hope. A real action reads more like: “Sarah audits the 3PL SLA breach report and reports findings by Thursday.” Without a specific action, a named owner, and a due date, the item isn’t a commitment. It’s a wish that will quietly disappear by next week.
The meeting opens by checking last week’s commitments, not this week’s numbers. High-performing teams check prior-week actions in the first five to ten minutes of the following meeting, before touching a single new metric. This single habit is what makes the review self-reinforcing. Skip it, and the team learns that commitments made in the room are optional.
Put together, these four mechanics form a loop:
- Review last week’s actions and mark each done, in progress, or missed.
- Scan the scorecard for anomalies using six-week and 12-month trend views.
- Discuss only the metrics flagged red or yellow, not the full list.
- Assign new actions with a named owner and a specific due date.
- Circulate the updated action register within an hour of the meeting ending.
How Do You Choose Which Metrics to Track?
Pick the wrong metrics and even a perfectly run WBR becomes useless, because no amount of great facilitation fixes a scorecard full of numbers nobody can move. The three criteria that matter are controllability, weekly movement, and clear ownership. A metric earns a spot on the scorecard only if someone in the room can directly influence it, if it actually changes meaningfully week to week, and if one person, not a committee, owns the number.
Most teams that get this right track a moderate number of core metrics. Too few usually means missing critical functions. Too many metrics dilute attention and risk turning the meeting back into a status recap rather than a focused review.
A workable scorecard usually pulls from four categories:
- Acquisition inputs: cost per click, click-through rate, new customer count, paid media spend efficiency.
- Conversion inputs: site conversion rate, cart abandonment rate, email capture rate.
- Retention inputs: repeat purchase rate, subscription churn, customer service response time.
- Operational inputs: inventory turns, fulfillment cycle time, on-time delivery rate, return rate.
The trick is pairing every output with at least one input that explains it. If margin is dropping, the scorecard should already include an input metric, like cost of goods or return rate, that’s driving that decline. If average order value is flat, the review shouldn’t just note the number. It should track the input levers behind it: bundle attach rate, upsell conversion, or free-shipping threshold performance.
For a consumer brand specifically, a few examples show how this plays out in practice. Inventory turns catch a slow-moving SKU before it ties up six figures in warehouse space. Onboarding completion rate for a subscription product flags a churn problem three weeks before it shows up in the retention number itself. AOV input drivers, like bundle attach rate or free-shipping threshold hits, tell a merchandising team exactly what to test next rather than just reporting that average order value didn’t move.
Pro Tip: If you can’t name the person who would change their behavior based on a metric moving, that metric doesn’t belong on your scorecard. Cut it, even if it feels important.
Building the 60-Minute Agenda: A Runbook You Can Copy
The agenda below is built for a leadership team running a weekly cadence, and it assumes the pre-read has already been read before anyone walks in. If people are seeing the numbers for the first time in the meeting, the timing below won’t hold.
The pre-read itself needs to be short, standardized, and circulated on a fixed schedule, as outlined in this practical readiness checklist for SaaS companies. A tight one-page format works best when it’s submitted 24 hours before the meeting, giving every attendee time to actually read it instead of skimming it at the door. Each metric owner’s section should include: this week’s actual number, the target, the variance, one flagged anomaly if there is one, and any cross-functional blocker that owner needs help clearing. Nothing else. A pre-read that turns into a slide deck defeats its own purpose.
Here’s the minute-by-minute breakdown for a 60-minute session:
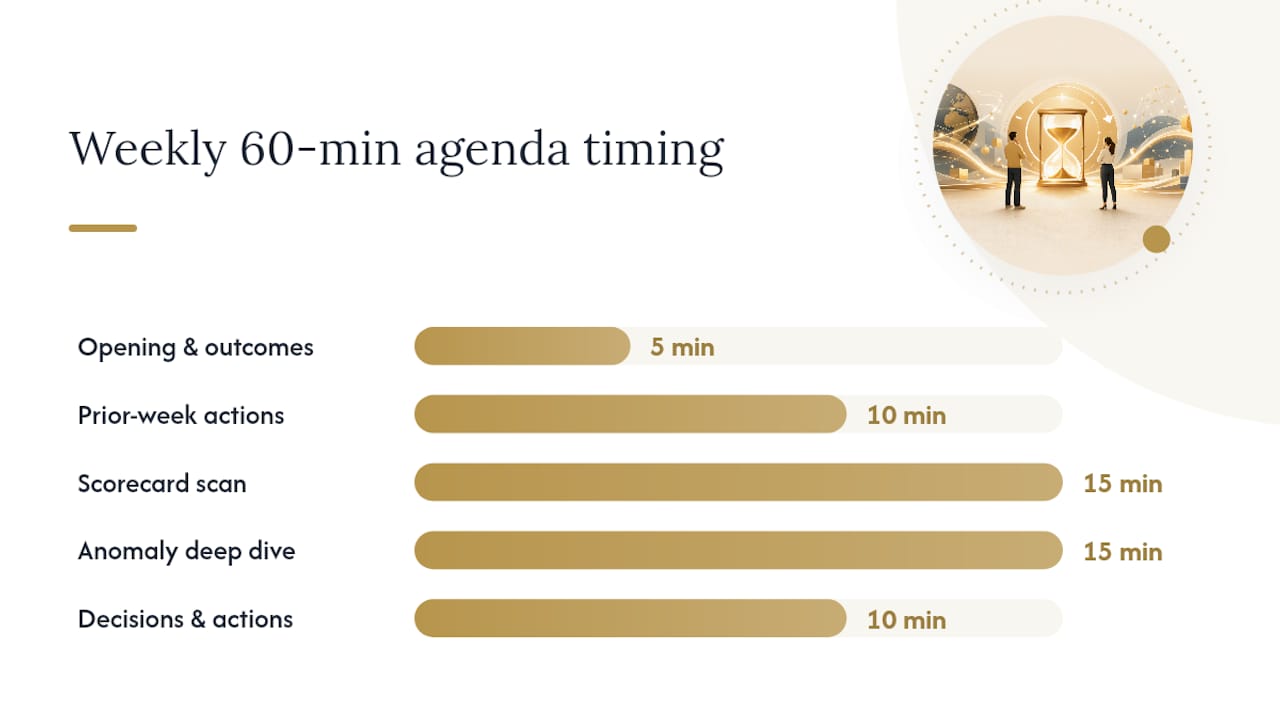
- Opening and outcomes (0 to 5 minutes). The chair states the meeting’s purpose for the week in one sentence and confirms who’s presenting which section.
- Prior-week action check (5 to 15 minutes). Go through last week’s action register line by line. Mark each item done, in progress, or missed, and ask why for anything missed.
- Scorecard scan (15 to 30 minutes). Walk the full metric list quickly, but only stop to discuss items flagged red or yellow. Green metrics get a nod and nothing more.
- Anomaly deep dive (30 to 45 minutes). Pick the two or three most significant flagged issues and dig in: what changed, why, and what decision is actually needed.
- Decisions and action assignment (45 to 55 minutes). For each issue discussed, name the specific action, the owner, and the deadline out loud in the room.
- Close and recap (55 to 60 minutes). The note-taker reads back the full action list to confirm everyone agrees on what was just committed to.
Four roles keep this running on time. The chair owns the agenda and decides what gets deep-dive time versus a quick nod. The timekeeper, often the same person, enforces the clock ruthlessly, because a 12-minute tangent on one metric eats the time budgeted for three others. Metric owners present their own numbers rather than having someone else read them, which builds real accountability. The note-taker captures every decision and action in real time and circulates the register within the hour, not the next day.
How Do You Keep a WBR Focused on Decisions, Not Discussion?
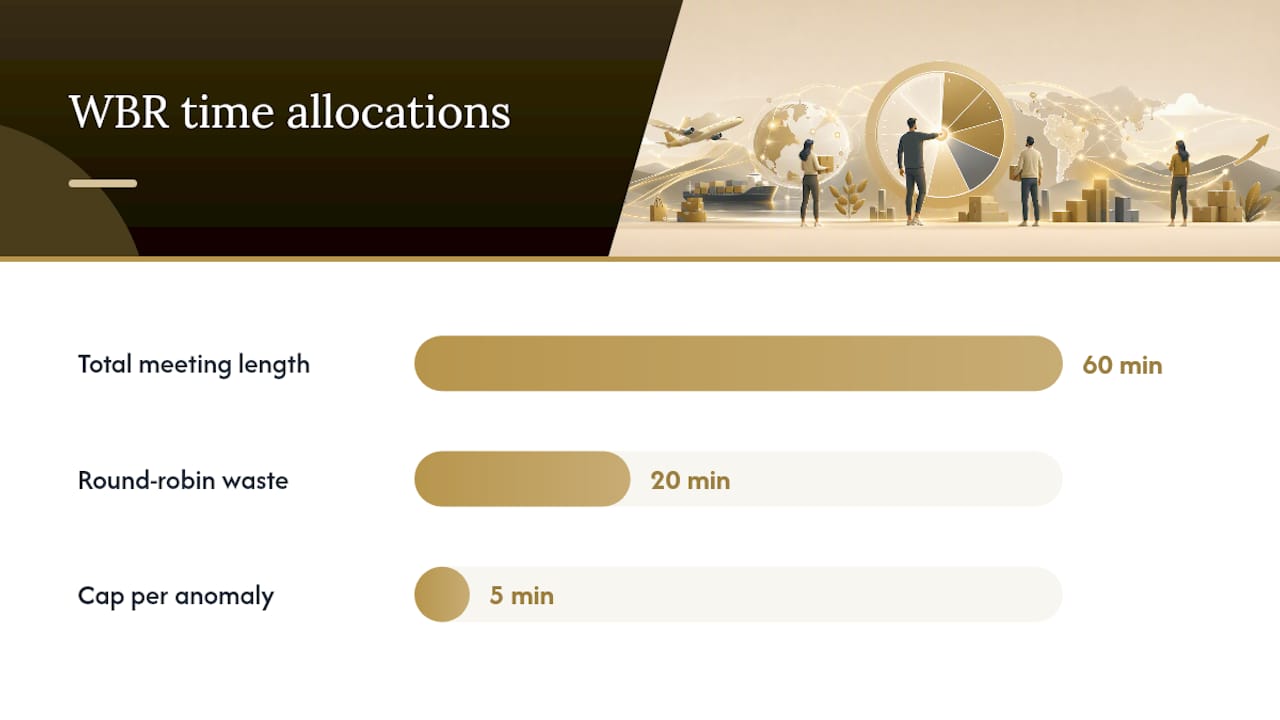
The single biggest facilitation mistake is opening with a round-robin. “Let’s go around the room and hear updates” is an invitation for every person to narrate their week in full, and it burns 20 minutes before anyone touches an actual problem. Open instead with the scorecard itself, ideally color-coded red, yellow, and green, so the room’s attention goes straight to what’s off-target. Consistency in this rhythm is what separates teams that sustain a WBR for years from those that let it fade after a few months, and opening with the scorecard rather than a status round is part of that discipline.
A few facilitator habits keep the conversation from sprawling:
- Ask “what changed?” before asking “why?” It forces a factual answer before people jump to explanations.
- Ask “what decision do we need right now?” for every red item, so the discussion has a destination.
- Cap anomaly discussion at five minutes per item. If it needs more, assign someone to investigate offline and report back next week.
- Redirect any tangent about a metric that isn’t flagged with a simple “that’s green, let’s keep moving.”
That “what changed, what decision” pairing does double duty: it surfaces the actual cause fast, and it stops the conversation from becoming a debate about opinions instead of a resolution of facts. Frameworks like the ones covered in founder decision tools can help structure that second question when the decision itself is genuinely hard, rather than obvious once the facts are on the table.
Pro Tip: If a discussion runs past its time cap and still hasn’t produced a decision, that’s a signal the issue needs its own separate meeting, not more minutes stolen from the WBR.
Circulate decisions the same day, not the same week. A decision that sits in someone’s notebook until Friday has already lost half its value, because the people who needed to act on it Monday are still waiting.
Tools and Templates That Keep the Process Sustainable
A WBR dies quietly when the weekly assembly of the pre-read becomes a bigger job than the meeting itself. Match the tool to the team’s size rather than reaching for the most sophisticated option available. A shared document works fine for a founder-led team tracking eight metrics by hand. A BI dashboard earns its complexity once you’re pulling from multiple systems, like ad platforms, an ERP, and a helpdesk, and manual copy-paste becomes a weekly time sink. A task tracker, separate from the metrics view, is what actually keeps the action register alive between meetings.
Whatever the format, the pre-read and the action register need the same core components every week: target, actual, variance, and owner for each metric, plus a running list of actions with names and dates attached. Building that structure once, inside something like a founder financial dashboard, turns a task that used to eat two hours into something closer to fifteen minutes of review before it goes out.
Designing the template to be machine-readable from the start, meaning consistent field names and formats a script or BI tool can pull automatically, is what actually gets assembly time close to zero over time.
- Shared documents: fine for fewer than 10 metrics and a single-team leadership group.
- BI dashboards: worth the setup cost once data lives in three or more separate systems.
- Task trackers: essential for the action register regardless of what handles the metrics themselves.
One warning worth taking seriously: more dashboards is not automatically better. A team that builds five different visualizations of the same ten metrics ends up debating which chart is right instead of what to do about the number. Pick one source of truth for the scorecard and treat every other view as a supplement, never a replacement.
Common Pitfalls That Kill a WBR (and How to Fix Them)
Every WBR that fails does so in one of a handful of predictable ways, and each has a specific fix rather than a vague “try harder.”
Status theater creeps back in. This happens when the meeting drifts back to people reading numbers aloud instead of discussing exceptions. The fix is enforcing the red/yellow/green scan and banning full round-robins entirely. If a metric is green, it doesn’t get airtime.
The scorecard grows past 15 or 20 metrics. More metrics feels like more rigor, but it actually dilutes attention across too many numbers to catch the ones that matter. Cut back to the 6 to 12 that are genuinely controllable and owned.
The cadence starts slipping. A meeting that gets rescheduled twice a month is a meeting that’s about to disappear entirely. Protecting the weekly slot matters more than having perfect data ready for it: a WBR with a slightly messy pre-read still beats no WBR at all.
Actions stay vague. “We’ll monitor it” isn’t an action, it’s a placeholder. Every item needs a name and a date, full stop. If an action can’t be finished within a week, break it into smaller weekly steps rather than letting it linger unowned for a month.
If two or three of these are happening simultaneously, don’t try to patch the meeting in place. Pause it for a week, rebuild the scorecard from scratch with the controllability test, and relaunch with a tighter pre-read. A WBR that’s been broken for months is harder to fix live than to rebuild from zero.
How Commerce Catalyst Applies WBR Mechanics to DTC Brands
Consumer brand founders usually don’t struggle with the concept of a weekly review. They struggle with knowing which numbers actually deserve a seat on the scorecard when cash is tight and every metric feels urgent. That’s the gap a DTC Operator Diagnostic is built to close: it identifies the two or three operating constraints, whether that’s inventory turns, contribution margin by channel, or fulfillment cost creep, that are actually limiting growth right now, and those constraints become the input metrics that anchor the WBR scorecard.
Founder Advisory sessions shorten the adoption curve considerably. Most founders trying to build a WBR from scratch spend the first month guessing at which metrics matter and the second month arguing about format. Working through the diagnostic output with a founder-side advisor compresses that into a working scorecard within a week or two, because the constraint analysis already points to the right inputs.
The DTC Operator Diagnostic extends this further for teams past the earliest stage, mapping operational bottlenecks, like slow inventory turns or rising customer acquisition cost, directly onto a metric set a leadership team can review every week without a finance background required to interpret it.
The outcomes founders report after this kind of engagement tend to cluster around two things: clearer priorities, because the diagnostic strips out vanity metrics that felt important but weren’t controllable, and tighter cash flow visibility, because the input metrics chosen are the ones that actually predict cash position weeks before it shows up on a bank statement.
Tailoring the WBR to Different Functions and Industries
A WBR built for a marketing-heavy DTC brand looks noticeably different from one built for an operations-heavy manufacturer, and forcing the same template onto both wastes the format’s whole advantage.
For marketing and growth teams, the scorecard leans toward acquisition inputs: cost per click trends, click-through rate by channel, and email list growth. For operations-heavy businesses, like manufacturing or fulfillment-driven brands, the review shifts toward inventory turns, on-time delivery rate, and supplier lead time variance. For finance and cash-focused reviews, the emphasis moves to burn rate, days of cash on hand, and accounts receivable aging.
Bain’s research on performance reviews makes a useful distinction here: run-the-business activity, the recurring, predictable work, needs the precise weekly targets a WBR provides. Change-the-business initiatives, like a new product launch or a market expansion, are usually served better by OKRs or milestone tracking reviewed monthly or quarterly, since a weekly cadence on a six-month initiative just produces noise.
A SaaS company reviewing weekly should weight the scorecard toward activation rate and monthly recurring revenue movement. A brick-and-mortar retail chain reviewing weekly should weight it toward foot traffic conversion and per-location sales variance. The mechanics stay identical. Pre-read, trend view, named actions, prior-week accountability. Only the metric categories shift to match what the business actually does.
What Do Successful WBR Formats Actually Look Like?
The most widely referenced version is Amazon’s, where leadership teams walk through a large number of metrics inside roughly an hour through what amounts to strict choreography: every second accounted for, every metric owner ready with an answer before being asked. That level of discipline isn’t accidental. It’s the product of years of refining exactly which metrics matter and cutting everything else.
Most founder-led companies don’t need anywhere near that scale to see the same benefit. A compact 45-minute leadership agenda built around exceptions only, roughly three minutes for opening, ten for a red-KPI scan, and the remaining time split between blockers and decisions, delivers most of the same value for a team tracking eight to ten metrics instead of eighty.
The pattern that shows up across every successful version, regardless of scale, is the same: a tight pre-read that eliminates in-meeting data assembly, a scorecard organized to surface exceptions instead of everything equally, and an action register that gets checked before anything new gets discussed. Teams that skip any one of those three tend to drift back toward the status-recap format within a few months, no matter how well the meeting started out.
Making the WBR Better Every Quarter
A WBR that never changes eventually stops earning its slot on the calendar. Metrics that mattered in the first quarter of running the review often stop moving the needle by the third or fourth, either because the underlying problem got fixed or because the business itself shifted focus.
Build a quarterly check-in into the cadence itself: once every 12 weeks, spend one full meeting reviewing the scorecard rather than the metrics on it. Ask which metrics haven’t moved meaningfully in a month, which ones nobody has actually acted on, and which new constraint has emerged that isn’t represented at all. Swap accordingly.
Feedback from the people actually running the meeting matters just as much as the data does. If a metric owner consistently shows up without a real answer for a red flag, that’s a signal the metric itself might not be genuinely controllable by that person, not a discipline problem to lecture them about. If the meeting keeps running long, that’s a signal the scorecard has grown past what a 60-minute review can actually cover.
The goal isn’t a perfect scorecard on day one. It’s a review that gets sharper every quarter because the team treats the format itself as something worth improving, not just the numbers inside it.
A Founder Advisor’s View on Protecting the Weekly Rhythm
Most founders don’t lose their WBR to a bad framework. They lose it to their own calendar. The meeting gets pushed for a fundraising call, then again for a supplier fire, and within six weeks the “weekly” review is happening every ten days with a scorecard nobody trusts anymore.
Two behavioral rules matter more than any template. First, the meeting time is fixed, and only a genuine emergency moves it, not a preference. Second, the chair reviews last week’s actions before looking at a single new number, every single time, because that habit alone is what makes the room believe commitments are real.
How Commerce Catalyst Can Help You Build This
If you’re staring at a dashboard full of metrics and can’t tell which ones actually deserve a weekly slot, that’s the exact problem a diagnostic is built to solve before you waste another month guessing. Commerce Catalyst’s DTC Financial Health Assessment identifies the two or three constraints actually limiting your growth right now, then hands you the input metrics that belong on your scorecard, instead of the twenty vanity numbers most teams start with.

A typical engagement starts with the assessment itself, which maps your current financial and operational picture against the constraints most likely to be capping growth for a brand your size. From there, Advisory sessions can help turn that output into a working weekly scorecard and action register you can run within a week or two, not a quarter. Founders coming out of this process typically gain a shorter, sharper metric list and a clearer read on cash position weeks before it might otherwise show up on a bank statement.
If your current review is either nonexistent or quietly falling apart, start with the assessment and build your first real scorecard from there.
Sources
- Startups
- Basedash: How to run a weekly business review
- Fairview: How to Run a Weekly Business Review That Changes Behavior
- Rhythm Systems: How CEOs build weekly strategy execution rhythms
- Bain: Building a next-level business performance review