
To separate fixed and variable brand costs, classify every line item as fixed, variable, or mixed, then use the high–low, scattergraph, or regression method to split mixed costs into their components before feeding the results into your CVP and scenario models. For most consumer brand founders, high–low takes under two hours with 12 months of data; regression takes longer but produces results you can defend to investors. Chris Wichert and Commerce Catalyst work through exactly this diagnostic with brands in the $5M–$75M range, and the output consistently changes pricing floors, break-even targets, and fundraising narratives.
- Start here: Pull 12–24 months of monthly cost and activity data (units sold or orders shipped work as drivers).
- Pick your method: High–low for speed; scattergraph to spot outliers first; regression for precision.
- Who owns it: Finance lead runs the data; founder reviews the split and validates against operational reality.
- Primary model affected: Cost-volume-profit (CVP) analysis, contribution margin, and break-even calculations.
Table of Contents
- Why separating brand costs changes your forecasting, pricing, and fundraising
- What counts as fixed, variable, or mixed for a consumer brand
- Three methods that split mixed costs: and when to use each
- How to run the analysis from data to validated results
- How to use the fixed/variable split in models and decisions
- Common mistakes that distort your cost structure analysis
- Key Takeaways
- The cost structure question most founders ask too late
- What Commerce Catalyst can do for your cost structure
- Useful sources and benchmarks
Why separating brand costs changes your forecasting, pricing, and fundraising
CVP models assume linear cost behavior within a relevant range, and a misclassified cost corrupts every downstream calculation. Treat a semi-variable fulfillment cost as purely fixed, and your break-even unit count is understated. Treat a step-fixed warehouse cost as variable, and your runway math overstates how long cash lasts.
Accurate cost classification is not a bookkeeping exercise. It is the foundation of every pricing decision, every channel investment, and every investor conversation you will have.
The pressure is real. Blended CAC for DTC brands has increased notably recently, with median ROAS relatively low and median operating margins for public DTC brands often negative in recent fiscal years. At those numbers, a one-point error in contribution margin is not a rounding issue. It is a strategic miscalculation. Knowing your true variable cost per order also determines whether a new retail channel is accretive or dilutive before you sign a purchase order.
For fundraising, investors want to see a clean fixed/variable split because it tells them how costs behave at 2x revenue. Founders who can position their brand for investment with a credible CVP model close rounds faster and negotiate from strength.
Pro Tip: When leadership time or rollout scope is uncertain, model brand activation costs as “soft variable” rather than fixed. They scale with scope, and treating them as fixed will cause you to underestimate burn during a launch or rebrand.
What counts as fixed, variable, or mixed for a consumer brand
Fixed costs do not change in total as activity rises or falls within your relevant operating range. Variable costs move in direct proportion to a cost driver. Mixed costs contain both a fixed base and a variable component that scales with activity.
Typical fixed costs for consumer brands:
- Rent and warehouse lease payments
- Salaried headcount (operations, finance, brand management)
- Annual SaaS subscriptions (ERP, e-commerce platform, email platform)
- Loan repayments and equipment depreciation
Typical variable costs:
- Cost of goods sold (raw materials, contract manufacturing)
- Per-order fulfillment fees from your 3PL
- Outbound shipping and per-unit packaging
- Sales commissions and affiliate payouts
- Ad spend tied directly to order volume
Mixed costs to flag for analysis:
- Utilities (fixed base charge plus usage-based component)
- Customer service staffing (base team is fixed; overtime scales with order volume)
- Agency retainers with performance bonuses
Brand-related costs deserve a specific decision rule. The initial design or strategy fee is largely fixed once contracted. Rollout and activation work, however, frequently doubles or triples the core agency fee, and those costs scale with the number of SKUs, channels, or markets you activate. Classify the design fee as fixed; classify rollout execution as variable or mixed. Leadership time, internal approvals, and training hours behave as hidden variable costs that accelerate with program scope. Model them accordingly, not as overhead.
For profitability best practices across brand rollout phases, the discipline of separating these line items before a launch prevents the most common founder mistake: funding the design but not the activation.
Three methods that split mixed costs: and when to use each
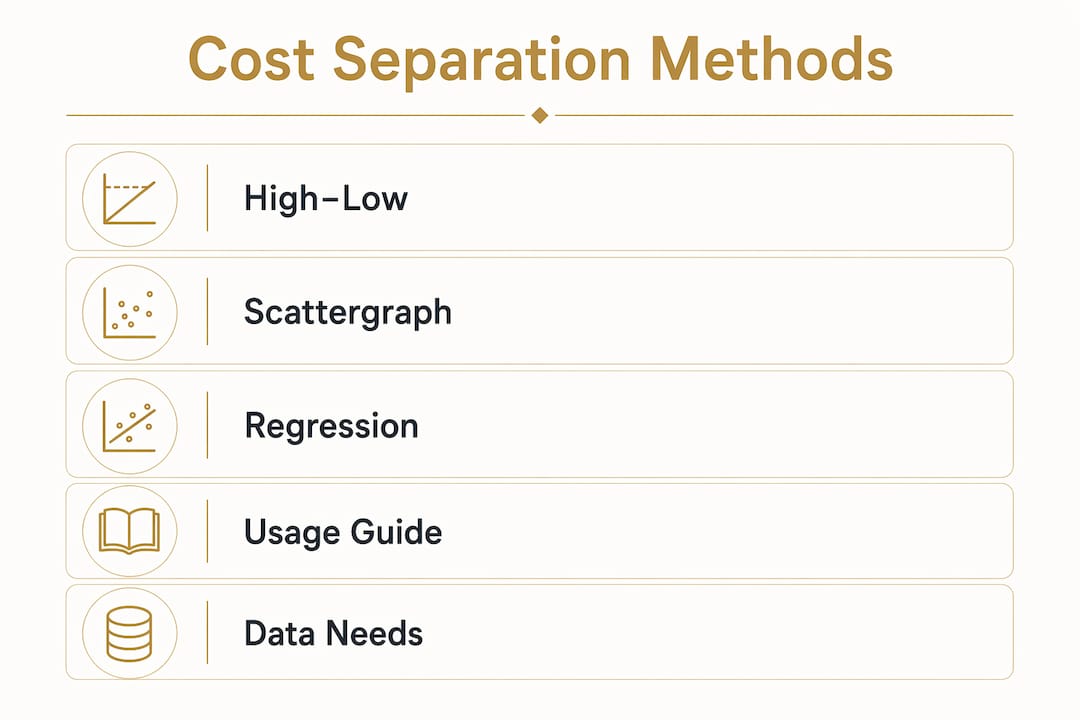
The three canonical techniques are high–low, scattergraph, and regression. Use them in that order as you need more accuracy or have more data available.
1. High–low method
Identify the highest and lowest activity periods in your dataset. Subtract the low cost from the high cost, then divide by the difference in activity units. That gives you the variable rate per unit.

Formula: Variable rate = (Cost at high activity – Cost at low activity) ÷ (High activity units – Low activity units)
Worked example: Your 3PL fulfillment cost was considerably higher in your highest month compared to your lowest month, with respective order volumes also differing substantially.
Variable rate equals the cost difference divided by the order difference, giving a clear indication of cost per order.
Fixed component equals the highest cost minus the product of variable cost per order and orders at that time.
High–low is fast but sensitive to outliers. If either endpoint is anomalous (a holiday spike, a stockout month), the result will be skewed.
2. Scattergraph method
Plot cost on the Y-axis and activity on the X-axis for every period in your dataset. Draw a best-fit line by eye. The Y-intercept approximates fixed cost; the slope approximates the variable rate. The real value of a scattergraph is diagnostic: it reveals outliers, non-linearity, and whether your cost driver is actually correlated with the cost before you run regression.
3. Regression analysis
Least-squares regression fits the line mathematically, minimizing the sum of squared errors. It uses all data points, not just two, which makes it far more accurate when you have 18–24 observations and a consistent cost driver. Excel’s LINEST function or Google Sheets’ SLOPE and INTERCEPT functions handle this without statistical software.
| Method | Data needed | Time to run | Best for |
|---|---|---|---|
| High–low | 2 periods (high + low) | Under 1 hour | Quick directional split |
| Scattergraph | 12+ periods | 1–2 hours | Outlier diagnosis |
| Regression | 18–24 periods | under two hours | Investor-grade precision |
How to run the analysis from data to validated results
The minimum viable dataset is 12 monthly observations with a single, consistent cost driver per cost line. Thirty-six months is better for regression. Before you start, confirm that the periods fall within a relevant range where cost behavior is actually linear. A period that includes a warehouse move, a major headcount change, or a COVID-era disruption should be excluded or flagged.
Data checklist:
- Monthly cost totals for each mixed-cost line item (from your P&L or accounting system)
- Corresponding activity driver values (orders shipped, units produced, or revenue)
- Notes on operational anomalies by period (promotions, stockouts, facility changes)
- Chart of accounts that separates fixed salaries from variable overtime
Good bookkeeping practices make this faster. If your chart of accounts lumps fixed and variable labor together, you will spend more time cleaning data than running the analysis.
Recommended tools: Google Sheets or Excel for high–low and scattergraph; Excel’s Data Analysis ToolPak or Google Sheets’ LINEST for regression. For brands with more complex cost structures, Tableau or Power BI can visualize the scattergraph and flag outliers automatically.
Realistic timeline: A finance lead with clean data can complete high–low in one afternoon. Scattergraph and regression, including outlier review, typically takes two to three days. If you are outsourcing to an external advisor, budget one week for data collection and one week for analysis and validation.
How to use the fixed/variable split in models and decisions
Once you have the split, three calculations change immediately.
-
Contribution margin per unit: Revenue per unit minus variable cost per unit. This is your true economic engine per order or SKU, and it sets your pricing floor for any channel or promotional decision.
-
Break-even units: Total fixed costs ÷ Contribution margin per unit. With a clean split, this number is reliable. Without it, you are guessing.
-
Special-order decision rule: Accept a short-run special order if the price exceeds variable cost per unit, as long as you have spare capacity. Fixed costs are irrelevant to this decision because they do not change with the order.
For scenario planning, run three versions of your P&L: base case, a 20% volume decline, and a 20% volume increase. Fixed costs hold flat in all three; variable costs scale with volume. The gap between scenarios reveals your operating use and tells you how much revenue cushion you actually have before cash turns negative.
Benchmark your contribution margin against sector data. The Fashion & Apparel Brand Benchmarks 2026 and Food & Beverage Brand Benchmarks 2026 provide reference ranges for CAC, gross margin, and LTV that let you pressure-test whether your split produces a contribution margin that is plausible for your category. If your calculated contribution margin is materially above or below the sector median, revisit your cost driver selection before presenting the model to investors.
When preparing investor materials, a clean CVP model with a documented fixed/variable split signals financial maturity. It answers the question every investor asks: “What happens to your margins at scale?”
Common mistakes that distort your cost structure analysis
The most financially damaging errors are misclassifying step-fixed costs as purely variable and treating leadership time as overhead.
- Step-fixed costs: A 3PL tier change, a new warehouse, or a permanent headcount hire creates a sudden jump in fixed cost. These costs are fixed within a range but jump suddenly, and forcing them into a linear model overstates your runway during scaling. Model them as step-fixed bands instead.
- Insufficient relevant range: Running high–low across periods that span two different cost structures (pre- and post-warehouse move) produces a meaningless variable rate.
- Unexamined outliers: A single anomalous month in a high–low calculation can swing your fixed cost estimate by thousands of dollars. Always plot the data first.
- Treating brand rollout as fixed: As noted above, activation costs scale with scope. Misclassifying them as fixed understates variable cost and inflates contribution margin.
These financial blind spots are among the most common findings in brand diagnostics, and they consistently produce break-even estimates that are too optimistic.
Pro Tip: When a cost is genuinely step-fixed, model it as a band: fixed at current capacity, then jumping to a new fixed level at the next capacity threshold. This gives your scenario models a realistic picture of how cash behaves as you scale through each step.
Key Takeaways
Correctly separating fixed and variable brand costs is the single strongest financial diagnostic a consumer brand founder can run, because every pricing, channel, and investor decision flows from an accurate contribution margin.
| Point | Details |
|---|---|
| Run high–low first | Pull 12 months of data and complete a directional split in one afternoon to validate your cost driver. |
| Use regression for precision | With 18–24 observations, regression produces an investor-grade fixed/variable split that holds up under scrutiny. |
| Update pricing after the split | Recalculate contribution margin per unit and reset your pricing floor for every channel and promotional decision. |
| Model step-fixed costs as bands | Treat warehouse and headcount jumps as step-fixed, not linear, to avoid overstating runway during scaling. |
| Commerce Catalyst Financial Assessment | Commerce Catalyst’s Financial Health Assessment delivers a documented cost split, updated CVP model, and decision checklist for brands ready to act. |
The cost structure question most founders ask too late
The brands that get this right early are the ones that can answer a specific question with confidence: “What is your contribution margin per unit, and what does it look like at 1.5x current volume?” That question separates founders who are managing their business from founders who are reacting to it. The profitability roadmap that follows a clean cost-separation exercise is not a financial document. It is an operating philosophy.
What Commerce Catalyst can do for your cost structure
Founders who want this analysis done right, fast, and tied directly to their pricing and investor narrative work with Commerce Catalyst’s DTC Financial Health Assessment. The engagement delivers a documented fixed/variable cost split for your key cost lines, an updated CVP model with break-even and contribution margin by channel, and a decision checklist covering pricing floors, scenario planning, and fundraising readiness. Most engagements complete within two to three weeks.

If you are not ready for a full assessment, the DTC Operator Diagnostic is a focused starting point that identifies your highest-impact cost drivers and flags the mixed costs most likely to distort your current model. Either way, the next step is a conversation with Chris Wichert about where your cost structure is hiding risk.
Useful sources and benchmarks
| Source | Best used for |
|---|---|
| AccountingCoach: Separating Mixed Costs | Step-by-step method reference for high–low, scattergraph, and regression |
| OpenStax Managerial Accounting | Foundational cost behavior theory and relevant range concept |
| SLM MBA: CVP Cost Segregation | CVP linearity assumptions and segregation methodology |
| Lumen Learning: Variable and Fixed Costs | Mixed cost definitions and contribution margin math |
| ValueAddVC: DTC Brand Economics 2026 | CAC, ROAS, and operating margin benchmarks for DTC brands |
| Commerce Catalyst Fashion & Apparel Benchmarks 2026 | Contribution margin and CAC reference ranges for fashion brands |
| Commerce Catalyst Food & Beverage Benchmarks 2026 | Gross margin and LTV benchmarks for F&B brands |
| Excel Data Analysis ToolPak / Google Sheets LINEST | Regression calculation without dedicated statistical software |