A data led prevention program beats punitive policy changes every time: rank your SKUs by return rate and margin loss, fix the top offenders on your product pages and sizing, then rebuild your returns flow around exchanges instead of refunds. The first move isn’t a new policy. It’s pulling last quarter’s return data and sorting it by SKU and reason code.
TL;DR:
- Focusing on fixing product pages for the top five SKUs with the highest return rates can significantly reduce overall returns.
- Segmenting return data by SKU, channel, reason, and category helps identify the most impactful items to address first.
- Implementing an exchange-first return flow with structured reason codes retains more revenue than refunds and improves customer satisfaction.
- Correcting sizing, fit, and description issues on product pages reduces “not as described” returns, which are mostly caused by inaccurate or incomplete information.
- Performing targeted quality control and operational fixes at packing and shipping stages can prevent many returns caused by damages or wrong items.
Table of Contents
- Returns Rate Reduction Starts With a Prioritized Action List
- How Do You Calculate and Track Your Return Rate?
- What Product Page Changes Actually Reduce Returns?
- Which Sizing and Fit Fixes Actually Move the Needle?
- How Do Exchange-First Return Flows Retain Revenue?
- What Operational Fixes Cut Merchant-Caused Returns?
- How Do You A/B Test Return-Rate Fixes?
- What Does a Returns Diagnostic Actually Deliver?
- Why Do Customers Actually Return Products?
- Can Customer Service Prevent Returns Before They Happen?
- What Quality Control Steps Prevent Returns Before Shipping?
- Do Lenient Return Policies Increase or Decrease Returns?
- How Are Brands Using AI to Predict and Prevent Returns?
- How Should You Communicate With Customers After Purchase?
- Three Bets That Move Margin Fastest
- How Commerce Catalyst Turns This Checklist Into Execution
- Sources
- FAQ
Returns Rate Reduction Starts With a Prioritized Action List
Most brands treat returns as a customer service problem. It’s actually a merchandising and operations problem wearing a customer service costume. Here’s the order that gets results fastest:
- Rank every SKU by return rate and dollar impact. A 30% return rate on a $20 item might matter less than an 8% rate on your $180 bestseller.
- Rewrite product pages for your worst five offenders. Fix photos, sizing copy, and specs before touching anything else.
- Add sizing or fit guidance to apparel and footwear listings. Even a basic chart moves the needle.
- Build an exchange-first return flow with structured reason capture. Every returned item should generate a reason code, not just a refund.
- Audit packaging, pick accuracy, and carrier damage rates. These are often the cheapest fixes with the fastest payback.
Each of these has a different owner and a different timeline. Product page fixes are a marketing or content task you can finish in a week. Exchange-first flow design usually touches your returns fraud prevention rules and your logistics provider, so budget a month. Packaging and carrier reviews are operations work that can start tomorrow.
How Do You Calculate and Track Your Return Rate?
Two formulas cover almost every use case, and they tell you different things. Unit return rate divides units returned by units sold over a period. It tells you how often people send things back, which matters for operations planning. Value return rate divides the dollar value returned by the dollar value sold. It tells you how much revenue actually leaves, which matters more to your P&L.
Quick math: if a return costs an estimated 20% to 65% of the item’s value to process once you account for shipping, inspection, and restocking, a SKU with a 25% return rate isn’t just losing sales. It’s actively burning margin on every unit that comes back.
Segment before you act. A blended return rate hides the truth. Break it down by:
- SKU and variant (size, color)
- Category (apparel behaves nothing like electronics)
- Channel (marketplace returns often run hotter than direct site returns)
- Return reason (fit, damage, wrong item, changed mind)
Your dashboard should carry five numbers at minimum: return rate by SKU, exchange uptake rate, retained margin per order, processing cost per return, and reason-code distribution. Report monthly in steady periods, weekly during peak season when a bad SKU can bleed cash fast.
What Product Page Changes Actually Reduce Returns?
“Not as described” returns are almost always a photography and copy problem, not a product problem. Fix the gap between what the page promises and what arrives, and a lot of returns simply stop happening.
Start here:
- Add scale references and 360 degree views. A ring photographed next to a coin tells a different story than one floating on white.
- Show the item worn across multiple body types and sizes, not just the sample model.
- Write specs that admit flaws. If a shoe runs narrow, say so. Honest copy filters out mismatched buyers before checkout.
- Surface fit and quality tags from reviews near the buy button. A high share of shoppers read reviews before purchasing, and fit-specific feedback does more to prevent a wrong-size order than any size chart alone.
Pro Tip: Prompt reviewers with a specific question like “Did this run true to size?” instead of a generic star rating. Structured prompts generate the exact data your next customer needs to avoid a bad purchase.
Roll changes out in order of damage: your highest-return SKUs first, then your best sellers, then everything else with real margin at stake. Don’t rebuild your whole catalog before you’ve fixed the five items causing half your headaches.
Which Sizing and Fit Fixes Actually Move the Needle?
Fit and size mismatches are consistently the single largest preventable cause of returns in apparel and footwear. That’s good news, because fit problems are also the most fixable ones on this list.
Build in layers, starting cheap:
- Publish garment measurements, not just size labels. “Medium” means nothing; a 40 inch chest measurement does.
- Add model height and size worn to every product photo caption.
- Write “if you’re between sizes” guidance directly on the page to stop bracketing, where a shopper orders two sizes intending to return one.
- Pilot a fit finder widget on a subset of SKUs before rolling it out catalog-wide. Retailer tests using recommenders reported a 2% cut in return rate and an 8% drop in size sampling for footwear, based on case data from three brands.
Test on 10 to 15 SKUs for one full sales cycle. Track both return rate and conversion rate side by side. A fit tool that cuts returns but tanks conversion isn’t a win, it’s a trade you haven’t priced correctly yet.
How Do Exchange-First Return Flows Retain Revenue?
The economics are simple: a refund is lost revenue, an exchange is retained revenue. Brands that build exchange-first flows convert a meaningful share of what would have been refunds into store credit or straight swaps, keeping that cash inside the business instead of reversing the transaction entirely.
Design the flow around a few rules:
- Offer instant exchanges by default for size and fit issues; save refunds for damage or wrong-item cases.
- Sweeten store credit slightly (an extra 10% in credit value, for example) to nudge undecided customers toward exchange over refund.
- Ship the replacement before the return lands back at the warehouse when the customer’s history supports it. This alone drives up perceived speed and satisfaction.
- Keep the UX simple. A pre-paid label and a two-click exchange selector beats a phone call to customer service every time.
Avoid the instinct to fix return rates by tightening the policy. A 14-day window that used to be 30 days won’t reduce returns; it just moves frustrated customers to chargebacks and negative reviews instead.
What Operational Fixes Cut Merchant-Caused Returns?
Not every return is the customer’s fault. A meaningful chunk comes from your own warehouse and shipping process, and those are often the cheapest fixes on this entire list.
- Right-size packaging for fragile SKUs. Too much empty box space means more shifting in transit and more damage claims.
- Run barcode verification at pick and pack, not just at final QC. Wrong-item returns usually trace back to this step.
- Sample-inspect a percentage of returns to catch patterns your reason codes might miss.
- Map damage claims by carrier and lane. If one regional carrier consistently damages more shipments, reroute that lane or renegotiate the contract.
These fixes rarely get board-level attention because they’re unglamorous. But packaging and carrier adjustments often deliver the fastest measurable win of anything on this checklist, precisely because nobody else is looking there.
How Do You A/B Test Return-Rate Fixes?
Guessing which fix worked is how most returns programs stall out after the first quarter. Structure every intervention as a real test.
- Change one variable at a time on a defined SKU set, holding everything else constant.
- Run a control cohort that gets no changes, so you can isolate the effect.
- Pick one primary metric before you start: usually retained margin per order or return rate for the targeted SKUs, not both.
Capture return reasons in two tiers: a broad reason (fit, damage, description mismatch) and a subreason (too small, torn in transit, color mismatch). That level of detail turns a vague “returns are high” complaint into a specific fix, like resizing your medium or adding a poly bag insert.
Pro Tip: Rank your fix backlog by return-rate delta multiplied by margin impact per SKU, not by which fix is easiest to build. The easiest fix on a low-margin SKU is often a waste of a sprint.
What Does a Returns Diagnostic Actually Deliver?
Before you commit a quarter to this work, run a fast internal audit: is your return data clean enough to segment by SKU? Do you have a ranked list of your worst offenders? Are your product pages and exchange flow ready to test?
A short DTC Operator Diagnostic or Founder Hour session typically surfaces the two or three SKUs driving most of your return losses within a few days, along with a prioritized fix list you can hand straight to your team.
Why Do Customers Actually Return Products?
Five reasons account for nearly every return, and each demands a completely different fix. Confusing them wastes your entire quarter.
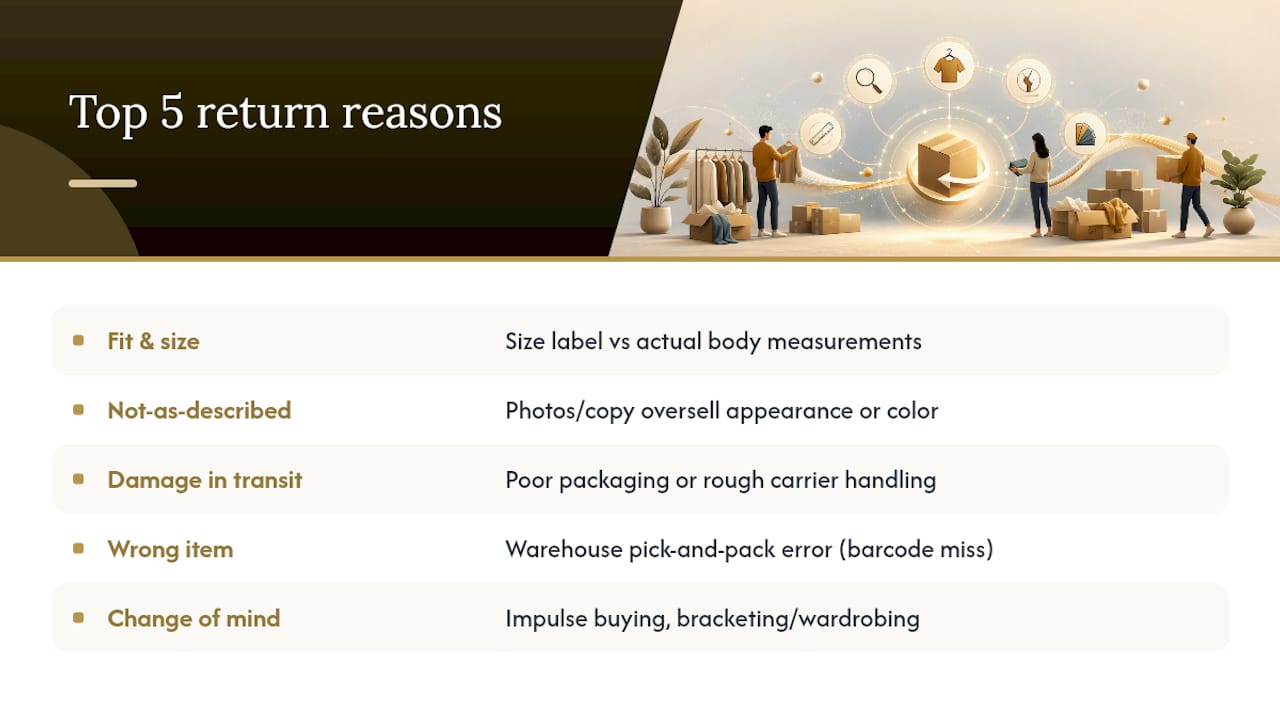
Fit and size mismatches dominate apparel and footwear categories. This isn’t a shipping problem or a quality problem, it’s an information gap between what the size label says and what a body actually measures. It’s also the most fixable category on this list, because the intervention (better charts, fit notes, honest sizing copy) is cheap and testable.
Not-as-described issues happen when photography, copy, or claims oversell the product. A couch photographed under studio lighting that looks navy but arrives more of a muted gray generates a return every time, regardless of how good the couch actually is.
Damage in transit traces back to your operations, not your customer’s judgment. Poor packaging, rough carrier handling, or a fragile product that was never designed for the box it ships in.
Wrong item shipped is almost always a warehouse pick-and-pack error, and it’s one of the few return reasons that’s entirely your fault and entirely preventable through barcode verification.
Change of mind is the hardest to fix because it’s not really a product problem at all. Some of it is impulse buying that regret catches up with. Some of it is bracketing, where a shopper orders multiple sizes or colors with a plan to return most of them. Academic research on consumer return behavior describes this pattern, sometimes called wardrobing, as a rational shopping strategy for the customer even though it’s expensive for you.
Knowing which bucket a return falls into changes everything about how you respond. Treating a damage-in-transit return the same way you treat a change-of-mind return means you’ll fix nothing and frustrate everyone.
Can Customer Service Prevent Returns Before They Happen?
Most customer service teams only touch returns after the box is already on its way back. That’s the expensive version of the job. The cheap version happens before checkout.
Proactive support means catching hesitation at the moment it appears. A shopper who spends four minutes on a size chart page and then abandons cart is a return risk waiting to happen, whether they buy today or next week. Live chat triggered by that exact behavior, offering a quick fit question, catches some of those sales before they turn into size-related returns.
FAQs deserve more real estate than most brands give them. A well-written FAQ that answers “how does this run” or “what’s the return process if it doesn’t fit” pulls double duty: it reduces pre-purchase uncertainty and it reduces post-purchase support tickets asking the same questions.
Post-purchase, the strongest move is speed. A customer messaging about a fit problem on day one is far easier to convert into an exchange than one who’s already decided to return and just wants a shipping label. Fast, specific responses (“that runs about half a size small, want us to send the next size up before you ship the original back?”) turn what would have been a straight refund into a retained sale.
Train support staff to ask the subreason, not just log a ticket as “return requested.” That single habit feeds your reason-code data and turns every customer service interaction into a data point for your merchandising team, not just a resolved ticket.
What Quality Control Steps Prevent Returns Before Shipping?
The cheapest return to prevent is the one that never leaves your warehouse. Quality control before shipping catches errors at a fraction of the cost of processing them after the fact.
Start with pick accuracy. Barcode scanning at every pick-and-pack station eliminates most wrong-item shipments, and the technology to do this exists at price points that fit small operations, not just enterprise warehouses.
Visual inspection matters more than most brands admit. A five-second glance at a garment for loose threads, a scratched electronics casing, or a misaligned print catches damage before it becomes a customer’s problem and your return. Sample-based inspection, checking a percentage of units rather than every single one, balances thoroughness against throughput for high-volume SKUs.
Packaging QC deserves its own checkpoint. Undersized boxes crush contents. Oversized boxes let items shift and collide. Both generate damage claims that show up in your return data as “item arrived damaged,” when the real root cause is a packaging spec nobody revisited since launch.
Batch testing helps for products with variability across production runs, particularly private label or manufactured goods where one bad batch can spike your return rate on a single SKU for weeks before anyone notices the pattern in aggregate data.
None of this requires new headcount necessarily. It requires a checklist, a few minutes per order, and someone accountable for the number when it slips.
Do Lenient Return Policies Increase or Decrease Returns?
The relationship between policy leniency and return rate is not a straight line, and this catches a lot of brands off guard when they tighten policy expecting an easy win.
A generous, long return window doesn’t necessarily cause more returns on its own. What it does is remove friction from the decision to buy in the first place, which increases sales volume, and increases the numerator and denominator of your return rate roughly together. Strict policies, by contrast, can suppress both purchases and returns simultaneously, which looks good on a return-rate percentage while actually costing you revenue.
The real lever isn’t leniency versus strictness. It’s what happens inside the return, exchange versus refund. A generous policy that channels returns into exchanges retains revenue even as raw return counts stay flat or rise. A strict policy that forces refunds only, with a short window and fees attached, drives away future purchases from customers who feel penalized, even the ones who never actually filed a return.
Restocking fees deserve particular skepticism. They protect margin on individual returns but tend to generate negative reviews and erode repeat purchase behavior, which usually costs more in lifetime value than the fee recovers. Before restructuring a policy for strictness, model that trade-off against retained customer value, not just against the immediate cost of the return itself.
How Are Brands Using AI to Predict and Prevent Returns?
Predictive tools are moving from novelty to standard practice for return-rate management, particularly around flagging risk before a return happens rather than reacting after.
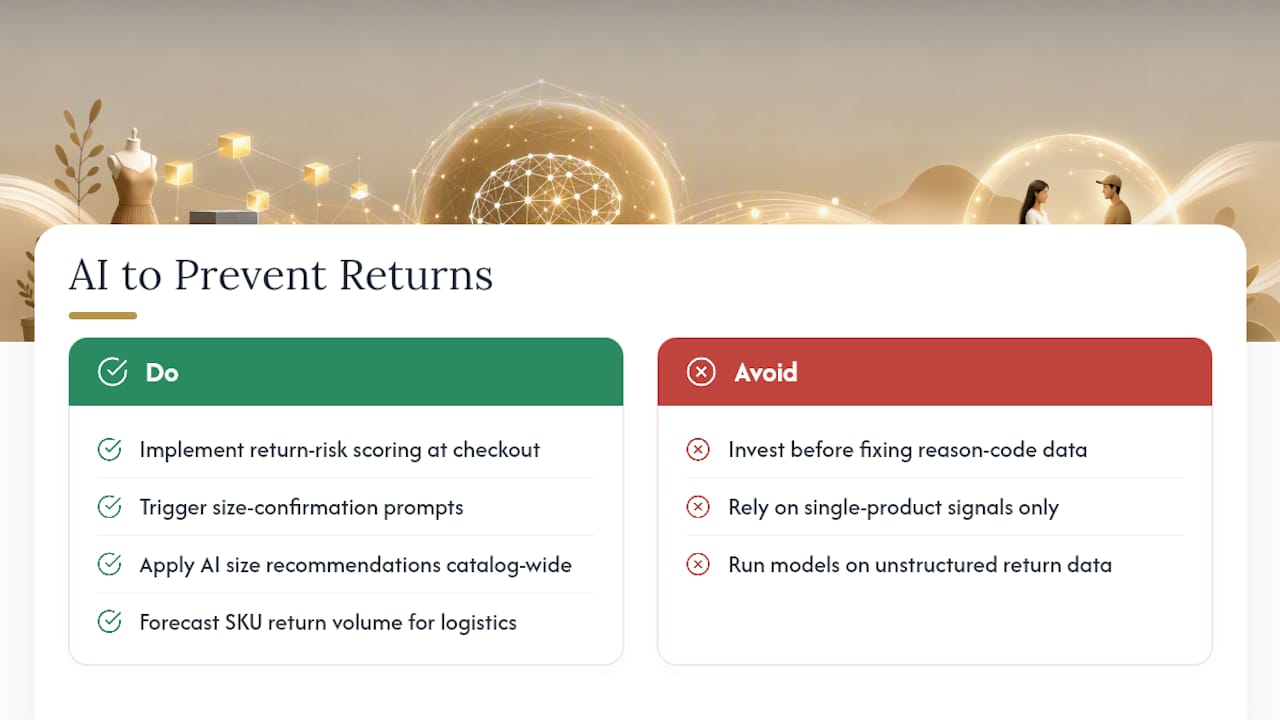
The most practical application right now is return-risk scoring at checkout. Models trained on past order data can flag combinations that historically return at a high rate, a specific size and fit history, a bracketing pattern (multiple sizes of the same item in one cart), or a category with historically elevated fit issues. That flag can trigger a size confirmation prompt or a fit-finder suggestion before the order ever ships, catching the problem at its cheapest point to fix.
On the merchandising side, AI-driven personalization and predictive signals are increasingly used to surface size recommendations based on a shopper’s past purchases and returns across a catalog, not just within a single product page. A customer who consistently orders a size up in one brand’s jeans gets that signal applied to a new item automatically.
Forecasting also matters on the inventory side. Predicting which SKUs are likely to generate high return volume this season lets operations teams plan reverse logistics capacity ahead of the spike, rather than scrambling during it.
The caveat: prediction only works with clean, structured return-reason data feeding the model. A brand that hasn’t fixed its data capture at the reason-code level will get mediocre predictions no matter how sophisticated the algorithm. Fix the input before investing in the tool.
How Should You Communicate With Customers After Purchase?
The period between checkout and delivery is when you can still prevent a return that hasn’t happened yet, and most brands waste it on generic shipping updates.
A confirmation email that resets sizing expectations (“this runs true to size based on our data” or “consider ordering up if you’re between sizes”) does more preventive work than any post-delivery survey. It arrives while the customer’s decision is still fresh and before the box has shipped, when a size swap costs almost nothing compared to a full return cycle.
Delivery-window accuracy matters more than brands assume. A customer expecting a package in three days who receives it in nine is primed to find fault with the product itself, even when the product is fine. Setting an honest, slightly conservative delivery estimate protects the unboxing experience from irritation that has nothing to do with the item.
Post-delivery, a well-timed check-in, not a survey blast, but a specific question tied to the actual item (“how did the fit work-out?”) catches problems while there’s still time to offer an exchange instead of losing the sale to a return that ships back untouched. This works especially well for first-time buyers, who return at higher rates than repeat customers simply because they lack a baseline for how your sizing runs.
Three Bets That Move Margin Fastest
Rank SKUs first. Fix the worst product pages next. Then rebuild your return flow around exchanges. Skip the board debate over restocking fees, that’s a distraction. Turn reason codes into a monthly merchandising task, not a quarterly report nobody reads.
How Commerce Catalyst Turns This Checklist Into Execution
Commerce Catalyst is the alternative to hiring a full consulting firm for returns work. You get a founder who’s actually run this playbook inside a scaling brand, not a framework deck. If you’ve read this far and you know exactly which SKUs are bleeding margin but don’t have the bandwidth to build the fix list yourself, that’s precisely the gap this closes.

The DTC Operator Diagnostic is built for exactly this kind of prioritization problem: a focused review that identifies your highest-impact constraints, including return-driven margin leaks, and hands you a ranked action list. If you want a faster, narrower conversation first, the Founder Hour at $500 per hour gets you direct, tactical input on which of these fixes to run first. For brands that need someone to actually run the program rather than just diagnose it, the Operator in Residence engagement provides hands-on execution support. Start with the diagnostic if you’re not sure where your return losses concentrate. That’s the fastest way to find out.
Sources
The return-rate figures and behavioral research cited above draw from the WISE literature review on product returns, retailer case data from The WP Clan, and cost benchmarks from Pango AI. For category-specific benchmarks, see Commerce Catalyst’s fashion and apparel benchmarks.
- Reducing the ecommerce return rate: three brands with numbers | The WP Clan
- Statista: Share of shoppers reading reviews before purchase
- Pango AI: How to reduce your ecommerce return rate
FAQ
How Do You Reduce Your Return Rate?
Rank your SKUs by return rate and margin impact, fix product page and sizing gaps on the worst offenders, and shift your return process toward exchanges instead of refunds. This SKU-first approach outperforms broad policy changes because it targets the specific items and reasons actually driving losses instead of applying friction to every customer.
What Is a Normal Return Rate for Ecommerce?
Return rates vary heavily by category, but online purchases return at roughly 19% to 20%, noticeably higher than in-store shopping. Apparel and footwear typically sit above that average because of fit-related issues, while categories like electronics or home goods usually run lower.
What Products Have the Lowest Return Rates?
Categories with little size or fit variability, like consumables, books, and basic home goods, tend to post the lowest return rates because there’s minimal gap between expectation and delivery. Apparel, footwear, and made-to-fit items sit at the opposite end, since fit and size mismatches drive the bulk of their returns.
What Counts as a Good Customer Retention Rate After a Return?
There’s no single universal benchmark, since retention after a return depends heavily on how the return was handled. Customers who get a fast exchange or store credit instead of a plain refund tend to come back and purchase again at meaningfully higher rates than those who go through a slow, refund-only process.
Can a Diagnostic Really Identify Which SKUs to Fix First?
Yes. A structured review of your sales, return, and margin data by SKU typically surfaces the two or three products driving a disproportionate share of return losses within days, not months. Commerce Catalyst’s DTC Operator Diagnostic is built specifically to produce that ranked list quickly.