MER is your business-level scoreboard. ROAS is your campaign-level steering wheel. If you only remember one thing from this article, remember that: MER tells you whether the business is healthy, ROAS tells you where inside your ad accounts to make adjustments. You need both, and treating either one as the single source of truth is how growth teams end up scaling their way into a cash crunch.
Here’s the operating rule. Use marketing efficiency ratio for total budget conversations, board updates, and anything you’d say to an investor. Use return on ad spend for the daily and weekly decisions inside Meta, Google, or TikTok, where you’re deciding whether to raise a bid or kill a creative. The Marketing Efficiency Ratio (MER) guide from HubSpot backs this same division of labor: ROAS is tactical, MER is strategic.
Before you read another paragraph, do two things:
- Pull last month’s total revenue and total marketing spend (ad spend, agency fees, creative production, tools) from your finance system, not your ad dashboards.
- Open one ad platform and check its reported ROAS for the same period, then compare the trend line against your MER trend line.
If those two numbers are moving in opposite directions, you’ve already found your first diagnostic clue. Keep reading.
Key Takeaways
MER measures whether your business is making money on marketing overall, while ROAS measures whether a specific campaign is efficient within a platform’s own attribution rules.
| Point | Details |
|---|---|
| MER governs budget | Use MER for board updates, quarterly budgets, and any investor-facing conversation about marketing health. |
| ROAS governs allocation | Use ROAS daily to weekly inside each ad platform to decide where budget goes within your MER envelope. |
| Anchor targets to margin | Calculate breakeven MER as 1 divided by contribution margin instead of copying a generic benchmark. |
| Watch for divergence | ROAS rising while MER falls usually signals cannibalization or inflated platform attribution. |
| Get a structured audit | Commerce Catalyst’s Financial Health Assessment finds where MER and ROAS have quietly diverged and prioritizes the fix. |
Table of Contents
- MER vs ROAS: Definitions and Formulas You Need to Lock In
- When to Use MER vs ROAS: A Decision Matrix
- How to Calculate MER, ROAS, aMER, and Contribution-Margin MER
- The ROAS Trap and Other Ways These Metrics Mislead You
- Building a Measurement System You Can Trust
- What Founders Get Wrong About MER and ROAS
- Case Studies: What MER and ROAS Actually Reveal in Practice
- Where MER and ROAS Both Fall Short
- Metrics Worth Tracking Alongside MER and ROAS
- Why the Conventional MER vs ROAS Debate Misses the Point
- Get Hands-On Help Fixing Your Measurement Stack
- Sources
MER vs ROAS: Definitions and Formulas You Need to Lock In
The confusion between these two metrics almost always comes down to sloppy denominators. Get the formulas exact, and the rest of this decision framework falls into place.
MER (marketing efficiency ratio) equals total business revenue divided by total marketing spend. It’s attribution free, meaning it doesn’t care which platform claims credit for a sale. It blends paid media, organic traffic, email, SMS, influencer fees, and agency retainers into one number, as the OWOX breakdown of marketing efficiency ratio lays out clearly.
Pro Tip: Before you calculate anything, write a one-sentence definition of “total marketing spend” and share it with finance. Half of the MER confusion in growth teams comes from marketing counting only media spend while finance is including headcount and software.
Your denominator checklist should include:
- Paid media spend across every platform (Meta, Google, TikTok, Amazon Ads)
- Agency fees and retainers
- Creative production costs (photography, video, freelance design)
- Marketing software and tooling subscriptions
- Influencer and affiliate payouts
ROAS (return on ad spend) equals platform-attributed revenue divided by ad spend on that specific platform or campaign. The catch is the word “attributed.” That revenue figure depends entirely on the attribution window and model you’ve set, whether that’s seven-day click, one-day view, or last-click across the entire funnel. Change the window, and the ROAS number moves without a single dollar of spend or revenue actually changing.
Two variants matter for founders managing real P&Ls. aMER (acquisition MER) isolates new-customer revenue divided by total marketing spend, which reveals acquisition efficiency that a blended MER can hide if your retention revenue is strong, a distinction the Adsights glossary on marketing efficiency ratio covers well. Contribution-margin MER swaps revenue for contribution margin in the numerator, giving you contribution margin divided by marketing spend. That version maps directly to breakeven and investment decisions, because it accounts for the cost of goods sold and fulfillment that pure revenue ignores.
When to Use MER vs ROAS: A Decision Matrix
Different questions call for different metrics, and mismatching them is where a lot of growth teams waste months chasing the wrong signal.
| Decision | Metric to trust | Recommended cadence |
|---|---|---|
| Board or investor budget approval | MER | Monthly |
| Setting total quarterly ad budget | MER | Monthly |
| Scaling or pausing a specific campaign | ROAS | Daily to weekly |
| Testing new creative variants | ROAS | Weekly |
| Adjusting platform bid strategy | ROAS | Daily |
| Diagnosing overall marketing health | MER | Weekly trendline |
The workflow that actually holds up in practice: MER sets the envelope, ROAS allocates inside it. Once your CFO or founder locks a monthly marketing budget based on target MER, your growth team spends that envelope across channels using platform ROAS to decide where each dollar performs best. It’s the same logic as a household budget: MER decides how much you’re spending on groceries this month, ROAS decides which store gets which dollar.
Pro Tip: Watch MER weekly and monthly, but check ROAS daily to weekly inside each platform. A weekly MER check is frequent enough to catch drift without overreacting to daily noise, according to the Marketing Efficiency Ratio (MER) guide.
Here’s how the two metrics play out in practice:
- When they align: MER is climbing and platform ROAS is climbing too. That’s your green light to scale spend, because the improvement is showing up in both the finance-level number and the platform-level number.
- When they diverge: ROAS on Meta looks great, but blended MER is flat or falling. That’s your signal to pause and investigate before you commit more budget, because something between the platform’s claimed credit and your actual bank balance isn’t adding up.
How to Calculate MER, ROAS, aMER, and Contribution-Margin MER
Numbers make this concrete faster than any explanation. Say your DTC brand did $500,000 in total revenue last month and spent $100,000 across all marketing line items.
- Calculate MER. Total revenue divided by total marketing spend equals MER. For example, earning multiple dollars in revenue for every dollar spent is a good sign.
- Calculate platform ROAS. Your Meta dashboard reports attributed revenue several times your ad spend, resulting in a ROAS greater than one. Note the attribution window: if Meta is using a seven-day click and one-day view model, some of that $280,000 may double count sales that also would have happened organically.
- Calculate aMER. If a portion of your total revenue came from new customers, then aMER reflects the ratio of new-customer revenue to total marketing spend, which is usually lower than blended MER. That’s meaningfully lower than your blended 5.0 MER, a signal that retention revenue is doing heavy lifting your acquisition spend isn’t earning credit for.
- Calculate contribution-margin MER. If your contribution margin is a portion of your revenue, contribution-margin MER is the ratio of contribution margin to marketing spend.
That last number is the one that matters most for solvency. Your breakeven MER equals 1 divided by your contribution margin percentage. At a 40% contribution margin, breakeven MER is 1 ÷ 0.40 = 2.5. Your contribution-margin MER of 2.0 sits below that line, which means you’re spending marketing dollars faster than your margin can absorb, even though your blended MER of 5.0 looks healthy on the surface. The Shopify guide to MER benchmarks makes the same point: there’s no universal “good” MER, because the right target depends entirely on your margin structure.
The ROAS Trap and Other Ways These Metrics Mislead You
Platform ROAS can look fantastic while your business quietly loses money, and that gap has a name in performance marketing circles: the ROAS trap. It happens when platforms claim credit for sales that would have happened anyway through organic search, email, or direct traffic, inflating the attributed revenue number without any real incremental lift.
Three specific mechanics drive it:
- Platform overlap. Meta, Google, and TikTok each claim credit for the same conversion under their own attribution model, so your summed platform ROAS can exceed 100% of actual revenue.
- View-through inflation. A one-day view attribution window counts anyone who merely saw an ad and later purchased, even without clicking, as a converted customer.
- Attribution-window changes. Widening a window from one day to seven days can make a stagnant campaign suddenly look like it’s improving, with zero change in actual performance.
Divergence between the two metrics is diagnostic gold if you know how to read it. Experienced operators watch for a specific pattern: ROAS climbing while MER falls typically points to paid media cannibalizing organic traffic or double counting across platforms, according to Adsights’ comparison of MER and ROAS. Run this checklist depending on which direction things move:
- ROAS up, MER down: Check whether organic and retention revenue dropped as paid spend rose, check for cannibalization between channels, and audit your creative mix for redundant targeting.
- MER up, ROAS down: Look for external drivers like a press mention, a viral moment, or a seasonal spike that’s lifting total revenue independent of your ad spend.
MER has one structural advantage worth remembering here: it’s built from store revenue and P&L numbers rather than pixel-based tracking, so it survives privacy changes and tracking disruptions that make ROAS unreliable, a point the Northbeam analysis of MER versus ROAS emphasizes.
Building a Measurement System You Can Trust
Good numbers require good governance, and this is the part most growth teams skip until a metric mismatch blows up a budget conversation.
- Lock your denominator and write it down. Decide exactly which spend line items count toward “total marketing spend” and don’t change that definition mid-period. A practical guide on MER for ecommerce operators recommends treating this as a governance document, not a one-time decision, with any change requiring a dated note and sign-off from whoever owns the budget.
- Pull data from finance, not dashboards. Use your accounting system or Shopify revenue export for the MER numerator, raw ad platform invoices for the spend denominator, and reconcile against actual agency bills rather than estimated fees.
- Report differently to different audiences. Executives and boards want a weekly MER trendline with contribution-margin context. Performance teams need daily or weekly ROAS broken out by campaign, with attribution window clearly labeled on every report.
- Run incrementality tests quarterly. A geo holdout or a 10 to 20% randomized spend pullback in one channel, measured over the following 30 to 90 days, tells you what your platforms’ attributed revenue is actually worth in causal terms.
Pro Tip: Start incrementality testing with your weakest-performing channel, not your strongest. You’ll learn faster whether that spend is truly incremental, and the downside risk to total revenue is smaller if the test confirms your suspicion.
This three-layer stack, weekly MER for health, campaign ROAS for steering, and periodic incrementality testing to calibrate what platforms claim, is the same structure recommended in OWOX’s guide to mastering marketing efficiency ratio.
What Founders Get Wrong About MER and ROAS
Target MER isn’t a fixed number you copy from a blog post. It’s a function of your contribution margin, full stop. A brand running 50% contribution margin can profitably sustain a MER as low as 2.0, while a brand at 25% margin needs a MER above 4.0 just to break even. Any benchmark you read that isn’t anchored to margin is decoration, not decision support.
The three mistakes we see most often in founder-side advisory work are painfully consistent across categories.
The first is mixing acquisition and retention revenue into one blended number and then wondering why paid spend “isn’t working” when retention was doing the heavy lifting. The second is redefining the marketing spend denominator between months, which quietly wrecks trend integrity without anyone noticing until a board asks why the trendline looks erratic. The third, and the most damaging, is chasing a strong ROAS while ignoring that contribution margin has been sliding for two quarters straight.
A Financial Health Assessment exists to catch exactly this pattern before it compounds. It maps your actual revenue and spend data against contribution margin, flags where MER and ROAS have quietly diverged, and hands you a prioritized list of what to fix first, not a generic audit deck.
Case Studies: What MER and ROAS Actually Reveal in Practice
Consider a mid-size skincare brand posting a strong 4.5 blended ROAS on Meta for three straight months. Leadership kept scaling spend on that signal alone. But blended MER over the same window slid from 3.8 to 2.9, and contribution-margin MER dropped below the brand’s breakeven line of 2.5. The gap was retention revenue quietly shrinking as new-customer acquisition spend crowded out email and SMS budget that had been driving repeat purchases.

A different pattern shows up in apparel brands running heavy influencer programs. Platform ROAS on paid social looked mediocre, hovering around 2.0, which triggered internal pressure to cut the channel. But MER stayed strong at 4.5, because influencer-driven traffic was converting through organic search and direct visits days later, revenue that never touched a paid-social pixel. Cutting the “underperforming” channel based on ROAS alone would have cut a driver that MER was already crediting correctly.
The pattern across both cases is the same: ROAS in isolation told a story that finance-level numbers contradicted. Brands that check both metrics on a routine cadence, rather than reacting to whichever one looks better this week, catch the divergence in weeks instead of quarters. That timing difference is often the gap between a manageable correction and a cash-flow emergency.
Where MER and ROAS Both Fall Short
Neither metric is a complete measurement system on its own, and treating either as gospel creates blind spots.
MER’s biggest limitation is that it can’t tell you which channel to cut or scale. It’s a health check, not a diagnostic tool, so a falling MER tells you something is wrong without telling you what. It also lags: because it’s built from finance data, you’re often looking at last month’s problem rather than this week’s.
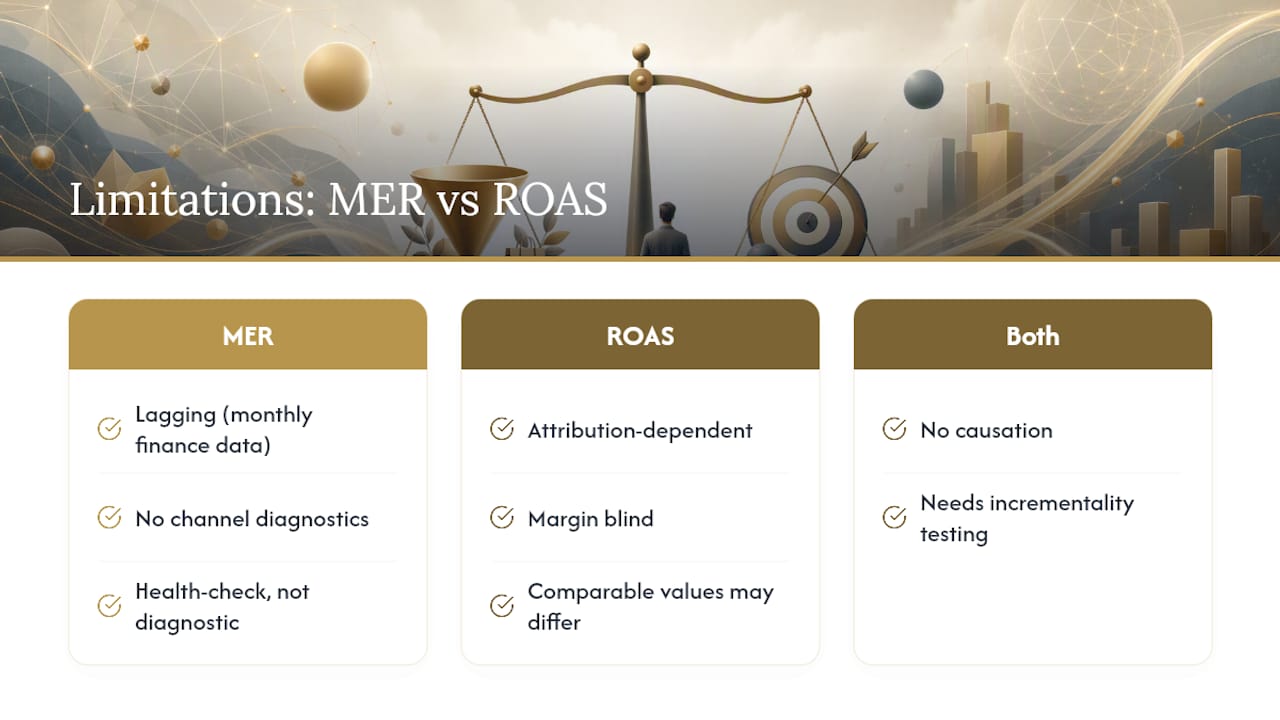
ROAS’s limitations are more widely known but still underestimated. It’s entirely dependent on attribution settings you control, which means two brands reporting “4.0 ROAS” may be measuring fundamentally different things. It also says nothing about margin, meaning a campaign can post an excellent ROAS on a low-margin product line and still lose money on every sale.
Both metrics share one blind spot: neither captures causation. A platform claiming credit for a sale doesn’t mean that sale wouldn’t have happened anyway. That’s why the Adsights glossary entry on marketing efficiency ratio recommends periodic incrementality testing as the third leg of the stool, not an optional extra.
Metrics Worth Tracking Alongside MER and ROAS
Contribution-margin MER, covered earlier, is the single most useful complement because it forces every efficiency conversation through the lens of actual profit rather than top-line revenue.
Customer acquisition cost (CAC) paired with customer lifetime value (LTV) rounds out the picture MER and ROAS can’t fully see on their own, since a healthy MER this quarter means little if CAC is climbing faster than LTV over a 12-month horizon. Payback period, the number of months it takes a new customer’s margin to cover their acquisition cost, matters especially for brands financing growth with a credit line rather than cash reserves.
For a vendor-neutral breakdown of when each metric earns its place in a reporting stack, the team at North Country Growth has published a solid practitioner-level comparison worth reading alongside this one.
Why the Conventional MER vs ROAS Debate Misses the Point
Most of what gets written about MER versus ROAS frames it as a competition, as if one metric should win and the other should retire. That framing is wrong, and it’s led plenty of smart operators astray. The real skill isn’t picking a favorite metric. It’s building the discipline to check both on a fixed schedule and act the moment they disagree.
What the research actually supports is narrower and more useful than most advice suggests: MER should govern your budget envelope, ROAS should govern allocation inside it, and the moment the two diverge is the most valuable data point you’ll get all month, not something to explain away.
Get Hands-On Help Fixing Your Measurement Stack
Commerce Catalyst exists for the exact moment described above: when ROAS looks fine, MER is drifting, and nobody on your team is sure which number to trust for the next budget cycle.

The Financial Health Assessment audits your actual revenue, spend, and contribution margin data to find exactly where MER and ROAS have diverged and why. The 90-Day Profit Sprint takes those findings and turns them into a prioritized set of fixes with a concrete timeline, rather than a diagnostic deck that sits unread. For brands that need the governance work locked in permanently, the Fractional COO engagement builds and maintains the denominator discipline and reporting cadence this article walks through. If your blended MER and contribution-margin MER have started telling different stories, book a DTC Financial Health Assessment and get a founder-level read on what’s actually driving the gap.