
A small consumer brand’s financial health comes down to four categories: profitability, liquidity, efficiency, and solvency. The metrics that matter most are gross margin, net margin, contribution margin, current ratio, quick ratio, operating cash flow, burn rate, debt-to-equity, and CAC:LTV. Pull these from your P&L, Balance Sheet, and Cash Flow statement every month. As Investopedia notes, focusing on top-line growth while ignoring cash flow and margins can leave a business insolvent despite reported profits.
Your immediate next steps: pull last month’s P&L and Balance Sheet, calculate net margin and cash runway, and drop both numbers into a one-page dashboard. That single action separates founders who are flying blind from those who can make a confident decision on pricing, hiring, or ad spend before the week ends.
Core metric shortlist:
- Profitability: Gross margin, net margin, contribution margin
- Liquidity: Current ratio, quick ratio, operating cash flow, burn rate/runway
- Efficiency: Inventory turnover, CAC:LTV
- Solvency: Debt-to-equity, ROE, ROA
Table of Contents
- What metrics should you track to measure financial health?
- Where do your numbers actually come from?
- How do your metrics change your next decision?
- Which tools pull live data into a dashboard you can trust?
- How often should you measure, and against what benchmarks?
- What mistakes are quietly distorting your financial picture?
- Your one-page financial health dashboard
- When should you bring in outside help?
- How do you forecast cash flow beyond the current ratio?
- How do you stress-test your brand’s financial resilience?
- How do you set financial health goals that are actually achievable?
- What tax implications affect your financial health assessment?
- Key Takeaways
- What most founders miss about financial health
- Commerce Catalyst turns your financial data into your next decision
- Authoritative sources and further reading
What metrics should you track to measure financial health?
Ratio analysis converts static statements into decisions on pricing, hiring, and capital allocation. The table below gives you the formula, what it reveals, and a practical target range for consumer brands.

| Metric | Formula | What It Reveals | Target Range (DTC/Consumer) |
|---|---|---|---|
| Gross Margin | (Revenue – COGS) / Revenue | Pricing and COGS health | 40–70% for DTC; varies by category |
| Contribution Margin | (Revenue – Variable Costs) / Revenue | True unit economics | Above gross margin threshold |
| Operating Margin | Operating Income / Revenue | Overhead efficiency | 10–20% for healthy brands |
| Net Margin | Net Income / Revenue | Bottom-line profitability | 5–15% for consumer brands |
| Current Ratio | Current Assets / Current Liabilities | Short-term liquidity | around 1.0 |
| Quick Ratio | (Cash + AR) / Current Liabilities | Immediate liquidity | above 1 |
| Operating Cash Flow | Net Income + Non-Cash Items – Working Capital Changes | Cash generation from operations | Positive; growing YoY |
| Burn Rate / Runway | Monthly Cash Burn; Cash / Monthly Burn | Survival horizon | a sustainable runway |
| Debt-to-Equity | Total Liabilities / Owner’s Equity | use and solvency risk | below 2 |
| CAC:LTV | LTV / CAC | Marketing efficiency | 3:1 or higher |
For early-stage brands, gross margin and cash runway are the most leading indicators. A subscription brand lives or dies on CAC:LTV; a one-time-product brand needs to watch inventory turnover closely.
Pro Tip: Identify the single metric furthest below its benchmark. Fix that one first. A targeted intervention: even a 5% price increase: compounds faster than spreading effort across every ratio simultaneously.
Where do your numbers actually come from?
Every metric traces back to one of three statements. Map them before you calculate anything.
| Metric | Primary Source | Key Line Items |
|---|---|---|
| Gross / Net Margin | P&L | Revenue, COGS, operating expenses, net income |
| Contribution Margin | P&L + variable cost detail | Revenue, variable COGS, variable marketing |
| Current / Quick Ratio | Balance Sheet | Cash, AR, inventory, current liabilities |
| Debt-to-Equity | Balance Sheet | Total liabilities, owner’s equity |
| Operating Cash Flow | Cash Flow Statement | Net income, depreciation, AR/AP changes |
| Burn Rate / Runway | Cash Flow + Bank | Monthly cash outflows, ending cash balance |
| CAC:LTV | P&L + CRM/ad platform | Ad spend, orders, AOV, repeat rate |
The SBA recommends accrual accounting for standardized, professional reporting. Private companies aren’t required to follow GAAP, but accrual-based statements make period comparisons and peer benchmarking far more reliable. Cash-basis books will distort your current ratio and operating cash flow, sometimes dramatically.
Data integrity checklist before you calculate:
- Bank statements reconciled to the penny for the period
- All invoices entered and AR aging current
- Inventory valued consistently (FIFO or weighted average, not mixed)
- Payroll and ad spend accrued in the correct period
Pro Tip: Pull numbers on the same calendar day each month. Reconcile AR and AP before running ratios. A common reporting mistake is calculating ratios from unreconciled books, which produces numbers you can’t trust.
How do your metrics change your next decision?
Metrics without decision rules are just numbers. Here is how each category should change what you do.
| Metric Signal | Decision Rule |
|---|---|
| Gross margin below target | Test a 5% price increase or renegotiate COGS with your 3PL/supplier |
| Net margin negative | Audit fixed overhead; identify the largest non-COGS cost center |
| Current ratio below 1 | Delay non-critical hires; negotiate extended payment terms with vendors |
| Quick ratio below 1 | Accelerate collections; consider a short-term line of credit |
| Burn rate rising | Pause discretionary ad spend; review inventory reorder cadence |
| CAC:LTV below 3:1 | Reduce paid acquisition until LTV improves or CAC falls |
| D/E above 1 | Pause debt-financed inventory; prioritize cash generation |
The worst-first rule applies here: fix the metric furthest below benchmark before touching anything else. Decision paralysis often comes from trying to improve everything at once. Founders who apply structured decision frameworks alongside financial data move faster and with more confidence.
Which tools pull live data into a dashboard you can trust?
The right tool reads your actual P&L and Balance Sheet. Survey-based health checks deliver subjective scores; tools connected to your accounting system deliver precise, repeatable numbers.
- QuickBooks (Intuit): The most widely used accounting system for small brands. Built-in P&L, Balance Sheet, and Cash Flow reports. Best for brands that want everything in one place and need clean source data for any downstream dashboard.
- Xero: Cloud-native, strong API ecosystem, and cleaner UI than QuickBooks for founders managing multi-currency or international suppliers. Integrates well with inventory and 3PL tools.
- Fathom: Connects directly to QuickBooks or Xero and generates visual financial reports, KPI dashboards, and period comparisons. Best for founders who want board-ready reporting without a CFO.
- Baremetrics: Purpose-built for subscription and DTC brands. Pulls MRR, churn, LTV, and CAC from Stripe or Shopify. Complements QuickBooks/Xero rather than replacing them.
Integration checklist before committing to a dashboard tool:
- Does it pull live data from your accounting system, or does it require manual input?
- Can it generate a P&L and Balance Sheet comparison across periods?
- Does it support NAICS or industry benchmarking?
- What is the update frequency: real-time, daily, or manual sync?
Pro Tip: Fathom and Baremetrics are most powerful when your QuickBooks or Xero chart of accounts is clean. Garbage in, garbage out. Spend one hour standardizing your account categories before connecting any dashboard tool.
How often should you measure, and against what benchmarks?
Monthly monitoring, quarterly strategy review, annual planning. That cadence is non-negotiable for a scaling consumer brand.
The U.S. Chamber of Commerce recommends comparing the current month to the prior month and the same month in the prior year. A single month is almost always misleading, especially for brands with seasonal demand. Rolling 12-month views smooth out noise and reveal structural trends.
| Cadence | Purpose | Key Action |
|---|---|---|
| Monthly | Operational monitoring | Calculate all 8–10 core metrics; flag any below benchmark |
| Quarterly | Strategy review | Compare to prior quarter and prior year; adjust targets |
| Annual | Planning | Set next-year benchmarks; update financial model |
For benchmarks, use RMA Annual Statement Studies or Dun & Bradstreet industry ratios filtered by your NAICS code and revenue band. A gross margin benchmark for a $500K apparel brand differs meaningfully from one for a $5M supplement brand. Always look at the full distribution, not just the median.
What mistakes are quietly distorting your financial picture?
The most damaging errors are also the most common.
- Revenue-only focus: Top-line growth without margin improvement is a vanity metric. A brand doing $3M with a 15% gross margin is in worse shape than one doing $1M at 55%.
- Single-month snapshots: One month of data tells you almost nothing without prior-month and prior-year context.
- Survey-based tools: Self-reported health scores don’t reflect your actual P&L. Connect dashboards directly to your accounting system.
- Ignoring cash runway: Profitable on paper, out of cash in 60 days. It happens more than founders expect.
Pro Tip: If operating cash flow diverges from net income for more than two consecutive months, investigate your AR aging and collections process immediately. That gap is almost always a receivables or invoicing problem.
Your one-page financial health dashboard
A founder-facing dashboard needs 5–8 metrics updated monthly to function as an effective control panel. Build it in a spreadsheet or connect it to Fathom.
| Field | Source | Traffic Light Trigger |
|---|---|---|
| Cash on Hand | Bank / Cash Flow | Red if below 3 months of burn |
| Runway (months) | Cash / Monthly Burn | Red below 3 months |
| Gross Margin % | P&L | Red below category benchmark |
| Net Margin % | P&L | Red if negative |
| Operating Cash Flow | Cash Flow Statement | Red if negative 2+ months |
| Current Ratio | Balance Sheet | Red below 1 |
| Debt-to-Equity | Balance Sheet | Red above 1 |
| CAC:LTV | Ad platform + CRM | Red below 3:1 |
Steps to build it:
- Export last month’s P&L, Balance Sheet, and Cash Flow from QuickBooks or Xero.
- Calculate each metric using the formulas in the metrics table above.
- Enter the result in the dashboard field and apply a traffic light: green (on target), yellow (within 10% of threshold), red (below threshold).
- Add a “prior month” and “prior year same month” column for each metric.
- Assign one person, founder or ops lead, to update the dashboard by the 10th of each month.
Pro Tip: Keep the financial KPI dashboard to one page. The moment it becomes a 10-tab spreadsheet, it stops getting used.
When should you bring in outside help?
A short financial audit or advisory engagement typically runs 30–90 days and delivers three things: reconciled statements, a prioritized action list, and a cash runway analysis.
| Engagement Output | What to Expect |
|---|---|
| Reconciled statements | Clean P&L, Balance Sheet, and Cash Flow ready for ratio analysis |
| Prioritized action list | The 2–3 interventions with the highest projected ROI |
| Cash runway analysis | Scenario-based runway under base, optimistic, and stress cases |
| One-page dashboard | Pre-built with your actual numbers and traffic light thresholds |
Red flags: vague scope, no connection to your accounting data, and a deliverable that is a slide deck rather than a working dashboard.
How do you forecast cash flow beyond the current ratio?
Liquidity ratios tell you where you stand today. Cash flow forecasting tells you where you are headed. A 13-week rolling cash forecast, updated weekly, is the standard tool for brands with under $5M in revenue. Map every expected inflow (customer payments, wholesale orders, returns) and every outflow (payroll, inventory, ad spend, debt service) by week. The gap between projected and actual cash each week is your early warning system.
Debt obligations deserve their own line. Know your repayment schedule, covenant thresholds, and the month when a balloon payment or renewal hits. Founders who track major cash commitments alongside operating cash flow avoid the surprise of a profitable quarter followed by a cash crisis.
How do you stress-test your brand’s financial resilience?
Scenario analysis is not a CFO exercise. It is a founder survival tool. Build three versions of your next 12-month forecast: base case (current trajectory), downside (revenue drops 20%, COGS rises 10%), and upside (revenue grows 30%, margins hold). Run each through your dashboard metrics and identify which scenario triggers a red flag first.
The downside scenario usually reveals two things: how quickly runway collapses and which fixed costs are actually variable if you act fast enough. Brands that run this exercise quarterly make better hiring and inventory decisions because they know their margin of safety.
How do you set financial health goals that are actually achievable?
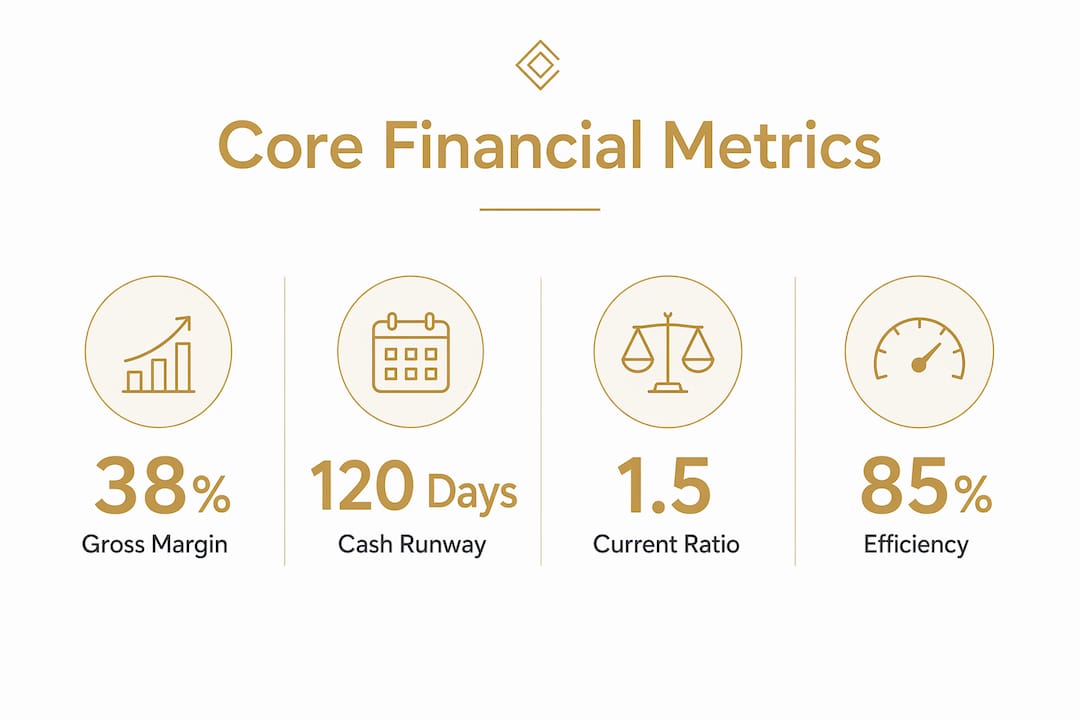
Start with your worst metric, not your most ambitious target. If your current ratio is 1.1 and your gross margin is 38%, fixing the current ratio first is the faster path to stability. Set a 90-day target for that metric, identify the two or three levers that move it, and review progress monthly.
Milestone structure matters. A 30-day milestone should be a data action (reconcile statements, build dashboard). A 60-day milestone should be a metric action (gross margin up 2 points). A 90-day milestone should be a decision action (hire, pause, or pivot based on the data). Goals without milestones are forecasts. Milestones without owners are wishes.
What tax implications affect your financial health assessment?
Tax obligations are a cash flow event, not just an accounting entry. Federal estimated taxes are due quarterly for most founders operating as sole proprietors, S-corps, or partnerships. Missing a payment triggers penalties that erode net margin. Build estimated tax payments into your monthly cash outflow forecast as a fixed line item.
Entity structure affects your effective tax rate and your ability to deduct certain expenses. An S-corp election, for example, can reduce self-employment tax exposure for profitable brands. State and local taxes vary significantly by jurisdiction and product category. Work with a CPA who understands your entity type and revenue model. This article is general information, not tax advice; confirm your specific obligations with a qualified tax professional.
Key Takeaways
Tracking the right metrics monthly, pulling from reconciled statements, and fixing the worst metric first is the fastest path to a financially resilient consumer brand.
| Point | Details |
|---|---|
| Four categories to track | Profitability, liquidity, efficiency, and solvency give a complete picture of brand financial health. |
| Fix the worst metric first | Target the single metric furthest below benchmark for the fastest, most compounding improvement. |
| Use accrual accounting | SBA guidance supports accrual-based reporting for reliable period comparisons and peer benchmarking. |
| Monthly cadence with YoY context | Compare current month to prior month and same month last year; a single month is almost always misleading. |
| Commerce Catalyst for structured support | Commerce Catalyst’s DTC Financial Health Assessment delivers reconciled statements, a one-page dashboard, and a prioritized action list in 30–90 days. |
What most founders miss about financial health
The conventional wisdom says “focus on growth.” The harder truth is that growth without margin is just a faster path to insolvency. The founders who scale successfully are not the ones with the highest revenue. They are the ones who knew their numbers well enough to make a hard call before the crisis forced it.
Financial confidence is not a personality trait. It is a practice. And the behavioral side of financial decision-making matters as much as the numbers themselves.
Commerce Catalyst turns your financial data into your next decision
Most founders have the data. What they lack is a clear line from that data to a specific action. Commerce Catalyst’s DTC Financial Health Assessment is built for exactly that gap. It starts with your actual P&L, Balance Sheet, and Cash Flow, not a survey, and delivers a reconciled one-page dashboard, a ranked list of the two or three interventions with the highest projected ROI, and a cash runway analysis under base and stress scenarios.

The founders who benefit most are those with early revenue who need repeatable financial systems and a clear prioritization framework before they scale. If your runway is under six months, your gross margin is below category benchmark, or your operating cash flow has been negative for two consecutive months, that is the signal to act. Book a 90-Day Profit Sprint or start with the assessment at commercecatalyst.ai/services/financial-assessment.
Authoritative sources and further reading
| Source | Why It’s Useful | Best For |
|---|---|---|
| SBA: Manage Your Finances | Official guidance on accrual accounting and financial management for small businesses | Accounting method decisions |
| U.S. Chamber of Commerce: Financial Metrics | Practical metric definitions, YoY comparison guidance, and benchmarking methodology | Cadence and benchmarking |
| HBS Online: Financial Health of a Company | Ratio analysis framework for strategic decisions on pricing, hiring, and capital | Ratio interpretation |
| Investopedia: Measuring Financial Health | Multidimensional health framework covering profitability, liquidity, efficiency, solvency | Framework overview |
| RMA Annual Statement Studies | Industry financial ratios by NAICS code and revenue band; full distribution percentiles | Peer benchmarking |
| Dun & Bradstreet Industry Ratios | Supplemental benchmarks filterable by NAICS and company size | Peer benchmarking |
| Chase: Determine Financial Health | Operating cash flow guidance and practical monitoring advice for small businesses | Cash flow monitoring |
For NAICS-filtered benchmarks, RMA and Dun & Bradstreet are the most reliable sources. Filter by your 4-digit NAICS code and the revenue band closest to your current annual revenue, then look at the 25th, 50th, and 75th percentile for each ratio rather than a single average.