
A path to profitability is a measurable, time-bound roadmap that shows investors exactly how your business transitions from burning capital to generating sustainable profit. Founders who can demonstrate this path to profitability to investors with specific milestones, unit economics, and scenario modeling are far more likely to close funding rounds in 2026’s capital-efficient climate. 82% of successful Seed and Series A rounds now include a dedicated profitability section, which means this is no longer optional. It is the standard investors expect before writing a check.
Why investors demand a clear path to profitability
Investors in 2026 are not rewarding growth at any cost. They are rewarding capital efficiency and proof that your business model can survive without perpetual external funding. The shift is fundamental: a compelling vision is not enough without the financial mechanics to back it up.
A profitability roadmap reduces investment risk by demonstrating that your startup can reach self-sufficiency. That single proof point changes the investor’s calculus from “will this company survive?” to “how fast will this company scale?” The difference in conversation quality is significant.
What investors specifically look for falls into three categories:
- Unit economics: LTV/CAC ratio, payback period, and gross margin trajectory that prove each customer relationship is profitable on its own terms
- Milestone credibility: Revenue targets, customer acquisition benchmarks, and operational gates tied to specific quarters, not vague future states
- Capital efficiency: Evidence that each dollar raised is being deployed toward measurable progress, not just keeping the lights on
“A clear path to profitability is not about promising future profits. It is about showing the logical, data-supported sequence of decisions and outcomes that make profit inevitable.”
The “default alive” mentality now dominates investor thinking at every stage from Seed through Series C. Founders who internalize this shift stop presenting growth stories and start presenting financial engineering stories. That reframe alone changes how investors respond in the room.
What financial metrics belong in your profitability roadmap
The metrics investors scrutinize most closely are the ones that reveal whether your unit economics actually work at scale. Presenting top-line revenue growth without these numbers signals either naivety or something to hide.

LTV/CAC ratio and payback period
Investor benchmarks require an LTV/CAC ratio of at least 3:1 and payback periods under 12 months, with anything over 18 months flagged as high-risk. These are not aspirational targets. They are the floor for a credible conversation. Use the unit economics calculator from Commerce Catalyst to model CAC, LTV, and payback period before you walk into any investor meeting.
What matters as much as the current ratio is the trend. Improving payback periods, such as moving from 18 months to 12 months over two quarters, signal operational improvement and disciplined execution. Investors read that trend as evidence that management knows how to tighten the business over time.
Gross margin trajectory and segment-level P&L
Gross margin tells investors how much room you have to invest in growth before hitting a structural ceiling. A DTC brand running at 35% gross margin has a fundamentally different profitability story than one running at 60%. Segment-level P&L analyses are critical because investors want to distinguish which parts of your business are genuinely profitable versus which are subsidized by capital.
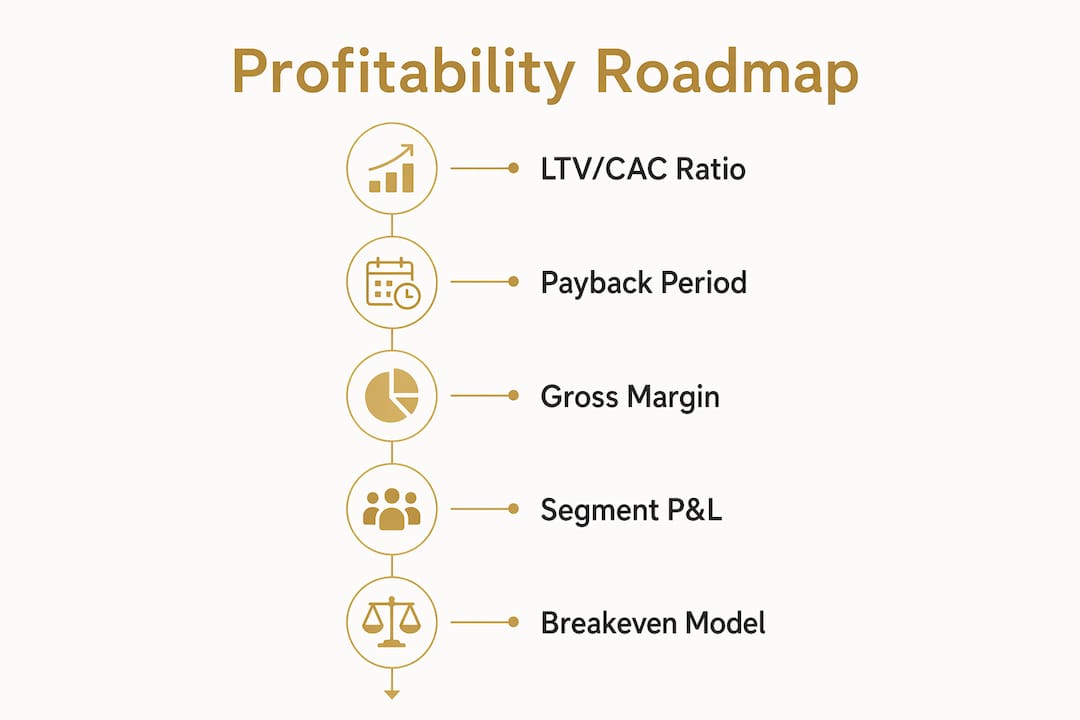
The table below shows the core metrics to include in your investors profitability roadmap and what each one communicates:
| Metric | What it signals to investors |
|---|---|
| LTV/CAC ratio (3:1 minimum) | Each customer relationship generates three times its acquisition cost |
| Payback period (under 12 months) | Capital is recovered quickly, reducing cash flow risk |
| Gross margin trajectory | Room to invest in growth without structural limits |
| Segment-level P&L | Transparency about which revenue streams are self-sustaining |
| Breakeven modeling | Specific month when operations no longer require external capital |
Pro Tip: Build your financial model with clearly labeled assumptions on a separate tab. Investors who stress-test your numbers will trust you more when they can see exactly what you assumed and why.
Breakeven modeling and the zero-burn milestone
The “Zero-Burn Month” arrives optimally around month 17 of an 18-month runway, balancing capital efficiency with growth reinvestment. Naming this milestone explicitly in your presentation, and showing the monthly burn trajectory that leads to it, gives investors a concrete anchor for evaluating your timeline. It transforms an abstract promise into a verifiable checkpoint.
How to build milestones that map to your profitability timeline
Milestones are the connective tissue between your current financial state and your profitability destination. Weak milestones are vague: “grow revenue significantly.” Strong milestones are specific, verifiable, and tied directly to the financial outcomes investors care about.
Follow this sequence when constructing your milestone framework:
- Set a breakeven target date. Work backward from your zero-burn month to identify what revenue, margin, and cost structure you need at each prior quarter.
- Define customer acquisition gates. Specify the exact number of customers or accounts required at each stage to hit your LTV/CAC and payback targets.
- Anchor product development milestones to revenue impact. Every product feature or channel expansion should connect to a measurable revenue or margin outcome, not just a launch date.
- Include operational scalability markers. Show investors when you will reach the team size, technology infrastructure, or supplier terms that unlock the next margin improvement.
- Assign ownership and accountability. Each milestone should have a named owner and a measurement method. This signals organizational maturity, not just financial planning.
The profitability roadmap guide from Commerce Catalyst walks through this milestone structure specifically for consumer brands, with templates adapted to DTC and ecommerce operating models.
Pro Tip: Present milestones in a visual timeline format within your pitch deck. Investors process sequences faster visually than in tables, and a clear timeline makes your assumptions about pacing immediately legible.
Linking milestones to your overall profitability timeline also gives you a natural framework for investor updates after the round closes. Founders who report against pre-stated milestones build credibility over time, which matters enormously when you return for the next raise.
Common mistakes that undermine investor confidence in profitability
The most expensive mistakes founders make when presenting their path to profit to investors are not calculation errors. They are credibility errors. Investors have seen thousands of decks. They recognize patterns that signal weak financial thinking instantly.
Watch for these specific failure modes:
- Hockey stick projections without validation. Revenue curves that accelerate sharply in year two or three without a clear explanation of what changes operationally to drive that acceleration read as wishful thinking. Every inflection point needs a named driver.
- Missing unit economics detail. Presenting blended CAC across channels hides the fact that some channels are deeply unprofitable. Investors at Series A and beyond will ask for channel-level breakdowns. Have them ready before they ask.
- Ignoring burn rate dynamics. Showing a path to profitability that requires raising another round before reaching breakeven is not inherently a problem. Failing to model what happens if that round is delayed by six months is a serious credibility gap.
- No scenario or sensitivity analysis. Transparent scenario and sensitivity analyses reflect strong financial stewardship and differentiate you from founders who present only the base case. A bear case that still reaches breakeven is more convincing than a base case with no stress testing.
- Verbal assertions without model support. Profitability claims without detailed modeling of gross margins and operating use are typically interrogated or dismissed during Series C due diligence. The model is the argument.
The fix for most of these mistakes is the same: build a financial model with testable assumptions, present it transparently, and show that you have already stress-tested it yourself.
Tools and resources for building a credible profitability presentation
Founders do not need to build investor-ready financial models from scratch. The right tools and templates reduce the time to a credible presentation and improve the quality of the underlying analysis.
| Resource type | Example tools and sources | Best use case |
|---|---|---|
| Pitch deck templates | WePitched 2026 profitability templates | Structuring the path to profitability slide sequence |
| Unit economics modeling | Commerce Catalyst unit economics calculator | Calculating CAC, LTV, payback period, and MER |
| Industry benchmarks | Commerce Catalyst fashion and apparel benchmarks | Validating your metrics against investor-expected standards |
| SaaS financial benchmarks | Fairview SaaS metrics guides | Modeling ARR breakeven targets for SaaS businesses |
| Business diagnostics | Commerce Catalyst DTC operator diagnostic tool | Identifying constraints before building your roadmap |
For SaaS founders specifically, late-stage companies are expected to demonstrate cash flow breakeven at $150M to $200M ARR with quarterly projections. That benchmark shapes how you structure your financial model from the earliest stages, since the trajectory needs to be credible at scale. For guidance on building the sales infrastructure that supports that trajectory, the SaaS sales scaling framework from Ahead of Sales offers a practical complement to the financial modeling work.
Presenting financials backed by detailed, testable assumptions and showing continuous improvement in key metrics builds considerable investor trust. The tools above make that level of rigor achievable without a full-time CFO on staff.
Key takeaways
Demonstrating a path to profitability to investors requires a data-backed roadmap built on unit economics, milestone mapping, and transparent scenario analysis, not just a compelling growth narrative.
| Point | Details |
|---|---|
| Lead with unit economics | Present LTV/CAC ratio, payback period, and gross margin trajectory as the foundation of every investor conversation. |
| Name your zero-burn milestone | Identify the specific month when operations reach breakeven and show the monthly burn trajectory leading to it. |
| Build milestones backward | Start from your breakeven target date and work backward to define quarterly customer, revenue, and operational gates. |
| Include scenario analysis | Present a bear case and a base case to signal financial maturity and reduce perceived investor risk. |
| Segment your P&L | Show investors which revenue streams are self-sustaining versus which require continued capital investment to grow. |
Build your investor-ready profitability roadmap with Commerce Catalyst
Founders who work with Commerce Catalyst move from financial uncertainty to investor-ready clarity faster because the process is built around the specific pressures of consumer brand scaling. Chris Wichert’s hands-on approach means you get a financial model grounded in real operating experience, not generic templates.
The DTC Financial Health Assessment gives you a structured audit of your unit economics, burn rate, and margin trajectory, producing the exact outputs investors scrutinize in due diligence. If you are preparing for a raise or want to stress-test your current roadmap, the Founder Hour is the fastest way to get direct feedback on where your profitability narrative is strong and where it needs work.
FAQ
What is a path to profitability for investors?
A path to profitability is a structured financial roadmap showing investors the specific milestones, unit economics, and timeline through which a business transitions from cash-burn to self-sustaining profit. It is the primary tool investors use to assess whether a business model is viable at scale.
What LTV/CAC ratio do investors expect?
Investors require a minimum LTV/CAC ratio of 3:1 and a payback period under 12 months. Payback periods over 18 months are flagged as high-risk and typically require a strong compensating explanation.
How do I show profitability without being profitable yet?
Show a trend of improving unit economics, a named breakeven milestone, and a scenario analysis that demonstrates your path to zero burn under realistic assumptions. Investors fund trajectories, not current states.
What financial metrics should I include in my investor pitch?
Include LTV/CAC ratio, payback period, gross margin trajectory, segment-level P&L, and a breakeven model with monthly burn projections. These five components cover the core of what investors scrutinize from Seed through Series C.
Why do investors reject hockey stick revenue projections?
Investors reject unsupported hockey stick projections because they lack named operational drivers for the inflection point. Every acceleration in your revenue curve needs a specific, credible explanation for what changes in the business to produce it.