Customer profitability analysis (CPA) is the practice of calculating how much profit each customer actually generates after subtracting every cost associated with serving them. The core formula is: Net revenue − direct cost − cost-to-serve = profit per customer. The single best first action you can take today is to pull net revenue and cost of goods for your top 20 customers, estimate a rough cost-to-serve for each, and rank them by profit. That one exercise will almost certainly reshape your commercial priorities before lunch.
Key Takeaways
Customer profitability analysis produces its highest value when net revenue is used as the starting point, cost-to-serve is explicitly measured, and results are connected directly to repricing, service-level, and account decisions.
| Point | Details |
|---|---|
| Start with net revenue | Always subtract discounts, rebates, and credit notes before calculating profit per customer. |
| Measure cost-to-serve explicitly | Capture order processing, returns, account management, and financing costs outside of COGS. |
| Run a pilot on your top 100 accounts | A sample run separates clear winners from losers and validates your model before a full rollout. |
| Refresh quarterly, act on triggers | Run a full CPA quarterly; refresh top accounts monthly and after any major contract or pricing change. |
| Commerce Catalyst accelerates execution | The DTC Financial Health Assessment delivers a ranked customer model and prioritized actions within weeks. |
Table of Contents
- What customer profitability analysis actually measures
- Core formulas and metrics you need to calculate
- A step-by-step process for running your first CPA
- How to allocate indirect costs accurately
- Common pitfalls that distort your results
- How to turn CPA results into prioritized decisions
- Tools and automation that make CPA repeatable
- A worked example: three customers, one clear picture
- How often to run CPA and what to track on your dashboard
- How external factors and seasonality affect your CPA results
- A perspective on what CPA actually changes
- Commerce Catalyst can run your first CPA pilot with you
- Sources
What customer profitability analysis actually measures
Most businesses track profit at the product or channel level. Customer profitability analysis shifts that lens to the customer, revealing that two accounts with identical revenue can have wildly different margins once you account for service costs, returns, payment terms, and order patterns.
It helps to distinguish CPA from two related but distinct tools:
- CPA vs. Customer Lifetime Value (CLV): CPA is backward-looking. It tells you what a customer has generated in a defined period. CLV is forward-looking, projecting future revenue and margin. Use CPA to diagnose the present; use CLV to allocate acquisition budgets.
- CPA vs. product or channel profitability: Product-level analysis tells you which SKUs earn margin. Channel analysis tells you which sales routes are efficient. Neither tells you which specific accounts are draining resources. CPA does.
- CPA vs. cohort LTV: Cohort LTV tracks monetization trends by acquisition group and surfaces early-warning signals that blended LTV masks. When you need to understand whether your newest customers are as valuable as those acquired two years ago, cohort LTV is the right tool. CPA and cohort LTV are complementary, not competing.
CPA is the right tool when you have recurring customers, meaningful variation in service costs across accounts, and at least one quarter of clean transaction data. The Balanced Scorecard framework formalizes this connection: customer satisfaction and retention metrics only create value when they translate into profit, and CPA supplies that financial link.
Core formulas and metrics you need to calculate
The arithmetic is clear. The discipline is in using the right inputs.
Core formulas:
- Net revenue = Gross revenue − discounts − rebates − promotional allowances − credit notes
- Contribution margin = Net revenue − direct cost of goods/services
- Cost-to-serve = Sum of all indirect costs attributable to serving that customer (sales visits, order processing, returns handling, custom packaging, extended credit)
- Profit per customer = Contribution margin − cost-to-serve
- Profit margin % = Profit per customer ÷ Net revenue × 100
Net revenue, not list price, must be your starting point. Concessions often convert an apparently high-revenue account into a low- or negative-margin one.
Supporting metrics to track alongside profit per customer include: percentage of unprofitable customers in your book, cumulative profit curve (the “whale curve”), average order value (AOV), customer acquisition cost (CAC), cohort LTV at months 3, 6, 12, and 24, churn rate, and LTV:CAC ratio. These metrics collectively inform acquisition and retention priorities in ways that no single number can.
The whale curve in practice: A CPA pilot typically reveals that a minority of customers generate the majority of cumulative profit, a middle band roughly breaks even, and a small tail of accounts actively destroys margin. This distribution, documented in Balanced Scorecard research on customer-level profitability, is the single most compelling argument for running CPA at all.
Data-preparation checklist before you calculate:
- Use net revenue, not gross; pull all concession lines from your ERP or billing system
- Include returns and credit notes in the period they were issued, not when the original sale occurred
- Align to a consistent 12-month window (or one full seasonal cycle for highly seasonal businesses)
- Unify currency, product codes, and customer IDs across CRM, ERP, and fulfillment systems
- Flag customers with fewer than three transactions; thin data makes their results unreliable
A step-by-step process for running your first CPA
A practical pilot on your top-customer sample will separate clear winners from losers faster than any full-population run. Here is the sequence:
- Define scope and period. Choose a 12-month window. Decide whether you are analyzing all customers or a representative sample. For a first run, the top 100 by gross revenue is a sensible starting point.
- Extract net revenue. Pull gross revenue per customer, then subtract all discounts, rebates, promotional credits, and return credits. This single step often reorders your top-10 list.
- Map direct costs. Assign COGS or direct service costs to each customer based on what they actually purchased. Use actual landed cost, not standard cost, wherever possible.
- Define cost pools. List every indirect activity that varies by customer: order processing, sales and account management time, inbound customer service contacts, returns processing, custom packaging, and financing cost of extended terms.
- Measure cost-to-serve. Quantify each cost pool using activity rates (see the next section on ABC). Even rough estimates, applied consistently, produce useful rankings.
- Allocate indirect costs. Assign cost-pool totals to each customer based on their actual consumption of each activity.
- Compute profit per customer. Subtract direct cost and cost-to-serve from net revenue. Calculate margin percentage.
- Rank and segment. Sort customers by profit, then by margin percentage. Group into tiers: high-profit, break-even, and loss-making.
- Run sanity checks. Verify that total allocated costs reconcile to your P&L. Spot-check two or three accounts manually. If a result looks implausible, trace the cost-driver assumption, not the customer.
- Sensitivity test. Shift one key assumption (returns rate, service hours per account) by 20% and observe how rankings change. Accounts whose ranking is sensitive to a single assumption need a closer look before you act.
Pro Tip: Start with your top 100 accounts by gross revenue. They likely represent the majority of your total revenue and will surface the most consequential decisions. Iterate to the full customer base only after you have validated the model on this sample.
Data sources to pull: your ERP for revenue and COGS, your CRM for sales activity and account management time, your 3PL or fulfillment platform for shipping and returns data, and your finance system for payment terms and credit note history.
How to allocate indirect costs accurately
The most common mistake in CPA is allocating overhead as a flat percentage of revenue. That approach systematically undercharges high-touch, low-revenue accounts and overcharges large, efficient ones. The result is a ranking that mirrors your revenue list rather than your profit reality.
Traditional allocation shortcuts are fast but misleading. Spreading overhead by revenue share or headcount treats a customer who calls your support team daily the same as one who never contacts you.
Activity-Based Costing (ABC) fixes this by tracing costs to the activities that actually consume resources, then assigning those activities to customers based on their usage. The limitation is that traditional ABC requires detailed activity surveys and can become expensive to maintain.
Time-Driven ABC simplifies the model to just two parameters: cost per hour of a resource group and the time each activity takes. A customer who requires three sales visits per quarter at 90 minutes each, plus 20 minutes of order-processing time per order, gets a precise cost assignment without a full activity survey. This method has been applied successfully across a wide range of organizations and scales to large customer sets without the maintenance burden of traditional ABC.
Concrete cost pools to capture in any CPA model:
- Sales visits and account management hours (time × fully loaded hourly rate)
- Order processing time per order (especially for small, frequent orders)
- Inbound customer service contacts (volume × average handle time × cost per minute)
- Returns processing (units returned × cost per return)
- Custom packaging or labeling requirements
- Financing cost of extended payment terms (days outstanding × cost of capital)
- Dedicated logistics or small-shipment surcharges
Pragmatic alternative for a first pilot: If you cannot yet build a full ABC model, estimate cost-to-serve using three tiers: low-touch (standard orders, no returns, standard terms), medium-touch, and high-touch. Assign a dollar estimate to each tier based on your best judgment of resource consumption. This is imperfect but will still separate your most and least profitable accounts with enough accuracy to drive decisions.
| Method | Accuracy | Setup speed | Data needs | Best use case |
|---|---|---|---|---|
| Flat % of revenue | Low | Very fast | Revenue only | Rough directional check only |
| Tiered cost-to-serve | Medium | Fast | Activity estimates | First pilot, small teams |
| Traditional ABC | High | Slow | Full activity surveys | Established finance function |
| Time-Driven ABC | High | Moderate | Cost per hour, time per activity | Scaling CPA across large customer sets |
Common pitfalls that distort your results
CPA is only as reliable as its inputs and assumptions. These are the failure modes that appear most often:
- Using gross revenue instead of net revenue. Discounts and rebates can represent 10–30% of list price in some consumer categories. Skipping this step makes your best-discounted accounts look far more profitable than they are.
- Ignoring concessions and credit notes. A customer who regularly receives goodwill credits for late deliveries or quality issues has a lower effective revenue than your invoice register shows.
- Poor cost-driver selection. Allocating support costs by revenue share when the actual driver is contact volume produces a model that punishes your largest accounts and subsidizes your most demanding ones.
- Stale data windows. A CPA built on data from 18 months ago may not reflect current pricing, terms renegotiations, or shifts in order patterns. Quarterly refreshes are the minimum for most businesses.
- Misreading blended LTV. Blended LTV averages across all cohorts and can mask the fact that your most recently acquired customers are significantly less valuable than those acquired two years prior. Cohort LTV surfaces these trends earlier and should run alongside CPA for any forward-looking decision.
- Treating CPA as the only input. A customer who is currently unprofitable may be strategically important: a reference account, a gateway to a new channel, or early in a growth trajectory. CPA informs the decision; it does not make it.
The mitigation for most of these is clear: use net revenue, document every cost-driver assumption, run a sensitivity test on the top five assumptions, and set a governance calendar for updates. CPA is inherently backward-looking, so pairing it with cohort LTV and forward-looking CLV projections gives you a more complete picture before you act on any account.
How to turn CPA results into prioritized decisions
Managing customers for profit rather than sales volume is the foundational principle here. Revenue growth that destroys margin is not growth worth pursuing.
The practical decision framework is impact × effort. Estimate the profit improvement from each potential action, then weigh it against the cost and complexity of implementation. High-impact, low-effort actions go first.
Action categories by account tier:
- High-profit accounts: Protect service levels, deepen the relationship, identify cross-sell and up-sell paths, and use their behavior as the template for acquisition targeting.
- Break-even accounts: Diagnose the specific cost driver making them marginal. Often a single change (minimum order size, shipping threshold, self-serve portal for routine inquiries) moves them into profitability without damaging the relationship.
- Loss-making accounts: Reprice, restructure terms, or exit. Not every loss-making account is worth saving. Some are worth a direct conversation about what a profitable relationship would look like; others are not.
For DTC and consumer brands specifically, the levers that most reliably shift customers between profitability bands are minimum AOV thresholds (which reduce the per-order overhead burden), shipping cost recovery on small orders, bundle pricing that raises contribution margin per transaction, and moving high-contact customers to self-serve channels for routine support. You can find concrete examples of how these levers play out in practice in this guide to unprofitable revenue streams.
Short-term quick wins (30–90 days): Reprice accounts below a defined margin floor, introduce minimum order sizes, and remove free-shipping thresholds that are costing more than they retain.
Medium-term process redesigns (90–180 days): Restructure service-level agreements by profitability tier, automate routine customer interactions, renegotiate payment terms with high-DSO accounts, and build tiered SLAs into your account management model. A profitability roadmap helps sequence these changes so you are not trying to execute everything simultaneously.
Tools and automation that make CPA repeatable
A spreadsheet is the right starting point for a CPA pilot. It forces you to understand every assumption before you automate anything. The limitation appears when you need to refresh the analysis monthly or run it across thousands of customers.
Tool categories by maturity:
- Spreadsheet templates (pilot phase): Excel or Google Sheets with a customer-level data model: one row per customer, columns for net revenue, COGS, each cost-pool line, and computed profit. This is sufficient for a first run on 100–200 accounts.
- BI dashboards (scale phase): Looker, Power BI, or Tableau connected to your ERP and CRM data sources. These enable automated refresh, whale-curve visualizations, and cohort filters without manual data pulls.
- Time-Driven ABC plugins and modules: Some ERP platforms (including SAP and Oracle) offer ABC modules. Standalone tools also exist for mid-market businesses that need more structure than a spreadsheet but less than a full ERP module.
- Integrated data platforms: For brands with complex fulfillment, multiple channels, and a 3PL, a data warehouse layer (Snowflake, BigQuery, or similar) that unifies CRM, ERP, and fulfillment data is the foundation for reliable, automated CPA at scale.
When to automate: if you are running CPA more than quarterly, have more than 500 active customers, or need to share results with a leadership team that cannot interpret a raw spreadsheet, automation pays for itself quickly.
Template fields your model must include: Customer ID, customer name, gross revenue, discount/rebate total, net revenue, COGS, contribution margin, each cost-pool line item (labeled by activity), total cost-to-serve, profit per customer, profit margin %, and a segment label (high/break-even/loss). Add a cohort acquisition date column if you intend to run LTV by cohort analysis alongside CPA.
A worked example: three customers, one clear picture
The following example uses three hypothetical customers to show the full calculation. The numbers are illustrative but sized to reflect realistic DTC consumer brand economics.
Customer B generates the highest gross revenue but the lowest profit margin once cost-to-serve is included. Customer A and Customer C are both strong performers, with Customer C slightly ahead on margin despite lower absolute revenue.
Sensitivity scenario: Increase Customer B’s returns rate so that returns processing doubles to $4,800. At that point, a direct conversation about minimum order sizes and a returns policy adjustment becomes a financial priority, not a relationship risk.
Replicable template notes:
- Always start with gross revenue and subtract concessions line by line.
- Use actual COGS from your ERP, not standard cost, for accuracy.
- Build each cost-pool line as a formula: activity rate × customer’s consumption of that activity.
- Sanity check: sum all customer profit figures and reconcile to your P&L net income (after fixed overhead allocation).
- Flag any customer where cost-to-serve exceeds 30% of contribution margin for immediate review.
How often to run CPA and what to track on your dashboard
Recommended cadence:
- Full run: Quarterly. This captures seasonal shifts, renegotiated terms, and changes in order behavior without becoming a continuous accounting exercise.
- Light refresh: Monthly for your top 20% of accounts by revenue. Pull net revenue and returns data; update cost-to-serve only if account behavior has materially changed.
- Ad-hoc triggers: Run an unscheduled CPA when you renegotiate a major contract, launch a new pricing tier, onboard a large new account, or observe an unexpected margin decline in your P&L.
Core KPIs for your CPA dashboard:
- Profit per customer (ranked list, updated quarterly)
- Profit margin % per customer
- Percentage of accounts that are unprofitable
- Whale curve: cumulative profit by customer rank
- Cohort LTV trend at months 3, 6, and 12
- CAC by acquisition channel
- LTV:CAC ratio by cohort
- Average cost-to-serve as a percentage of net revenue
Dashboard wireframe: Lead with a ranked customer list filterable by time window, channel, and product category. Place the whale curve chart alongside it so leadership can immediately see the concentration of profit. Add a cohort LTV panel below for forward-looking context. The goal is a single screen that answers three questions: who is profitable today, how has that changed, and where is the trend heading?
For brands building this out for the first time, the profitability best practices guide covers the governance and operational cadence in more detail.
How external factors and seasonality affect your CPA results
CPA is a snapshot, and the business environment it captures is never static. Ignoring external factors when interpreting results is one of the subtler ways that a technically correct analysis leads to a wrong decision.
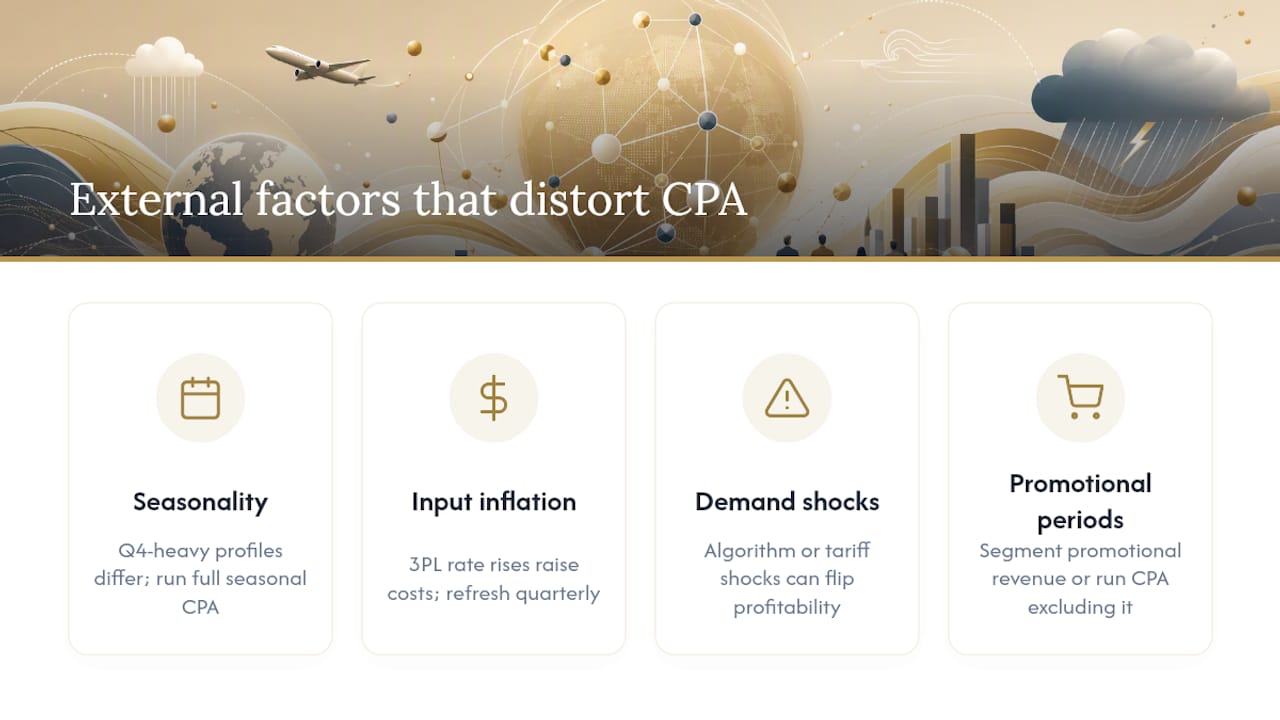
Seasonality is the most immediate distortion. A consumer brand with a Q4-heavy revenue profile will show dramatically different per-customer economics in a 12-month window than in a rolling 6-month one. A wholesale account that orders heavily in October and November may look highly profitable on an annual basis but generate negative cash flow for nine months of the year. The fix is to run CPA on a full seasonal cycle and to annotate results with the seasonal pattern before drawing conclusions about account health.
Input cost inflation changes your cost-to-serve without any change in customer behavior. If your 3PL raises fulfillment rates mid-year, every customer’s cost-to-serve increases. Accounts that were marginally profitable may cross into loss-making territory through no fault of their own ordering patterns. Quarterly refreshes catch this; annual-only CPA does not.
Demand shocks and market disruptions can rapidly shift which customers are worth serving. A channel that was profitable before a major platform algorithm change or a tariff adjustment may look very different six months later. CPA results from before the disruption should not drive decisions made after it.
Promotional periods create temporary distortions. A customer who only buys during deep-discount events will show a very different margin profile in a period that includes a major sale than in one that does not. Segment promotional-period revenue separately, or run a parallel CPA that excludes promotional transactions, to understand the underlying account economics.
The practical discipline is to document the external context alongside every CPA run: note input cost changes, major promotional events, and any market disruptions that occurred during the measurement window. That annotation turns a number into a defensible business case.
A perspective on what CPA actually changes
There is a version of CPA that gets treated as a finance exercise: run the numbers, file the report, move on. That version produces no change. The version that actually moves margins is one where the results are connected directly to commercial decisions: a pricing conversation, a service-level restructuring, a minimum order policy. The analysis is only as valuable as the action it triggers.
The other thing worth saying plainly: CPA is not a tool for firing customers. It is a tool for having honest conversations about what a profitable relationship looks like. Most accounts, when presented with the economics, will negotiate. Some will not, and that is useful information too.
Commerce Catalyst can run your first CPA pilot with you
Running a customer profitability analysis for the first time is clear in concept and genuinely difficult in execution. The data is scattered across systems, the cost-driver assumptions require judgment, and the results need to be translated into decisions that your commercial team will actually act on.

Commerce Catalyst’s DTC Financial Health Assessment is built for exactly this moment. Working directly with your data, the engagement produces a ranked customer profitability model, a prioritized list of account actions, and a clear view of where your margin is being lost. For brands that need ongoing support to operationalize the findings, the fractional CFO service embeds that capability without a full-time hire. Most engagements move from raw data to a prioritized action list within two to three weeks. If you are ready to see what your customer book actually looks like, book a financial assessment to get started.
Sources
- A Balanced Scorecard Approach To Measure Customer Profitability
- How to Calculate Customer Profitability: A Step-by-Step Guide
- Customer Profitability Analysis: Metrics, Steps + Strategies (2025) | Saras Analytics
- Customer Profitability Analysis - Formula, Benefits
- Manage customers for profits, not just sales