Return on Ad Spend (ROAS) is defined as the revenue a brand generates for every dollar spent on advertising, expressed as a ratio, multiple, or percentage. A 4:1 ROAS means your ads produced $4 in revenue for every $1 spent. Understanding what ROAS means for brands goes far beyond memorizing a formula. The metric sits at the center of every advertising budget decision, yet most brand marketers misread it by ignoring the cost structure underneath. This guide covers the calculation, the limits, and the advanced measurement approaches that separate profitable brands from ones chasing misleading numbers.
How to calculate ROAS and what the numbers actually mean
ROAS is calculated by dividing revenue attributed to ads by total advertising spend. The formula is clear: ROAS = Revenue from Ads / Ad Spend. A result of 4 means $4 returned per $1 spent, written as 4:1, 4x, or 400% depending on the platform or report you are reading.
The three formats represent the same result in different skins. A ratio (4:1) is common in agency reports. A multiple (4x) shows up in most ad dashboards. A percentage (400%) appears in finance-oriented tools. Knowing which format your team uses prevents misreads when comparing results across channels.
Interpreting ROAS correctly requires context, not just the number itself. A 3x ROAS on a paid social campaign looks weak next to a 6x ROAS on branded search, but branded search captures demand that already existed. The channel matters as much as the figure.
Here is how to calculate ROAS step by step:
- Identify total ad spend. Include creative costs, platform fees, and any agency management fees tied to that campaign.
- Identify attributed revenue. Pull this from your ad platform, but note the attribution window used (7-day click, 1-day view, etc.).
- Divide revenue by spend. Revenue / Spend = ROAS.
- Convert to your preferred format. Multiply by 100 for percentage, or express as a ratio by adding “:1.”
- Compare against your break-even ROAS, not an industry average.
Pro Tip: Always confirm which attribution window your platform uses before reporting ROAS to stakeholders. A 28-day click window will produce a much higher number than a 7-day click window for the same campaign.
Why ROAS alone does not equal profitability for brands
ROAS measures channel efficiency as revenue divided by ad spend only. It excludes cost of goods sold (COGS), fulfillment, returns, overhead, and agency fees. ROI, by contrast, measures total business profitability after all costs. The two metrics answer different questions, and confusing them is one of the most expensive mistakes a brand can make.
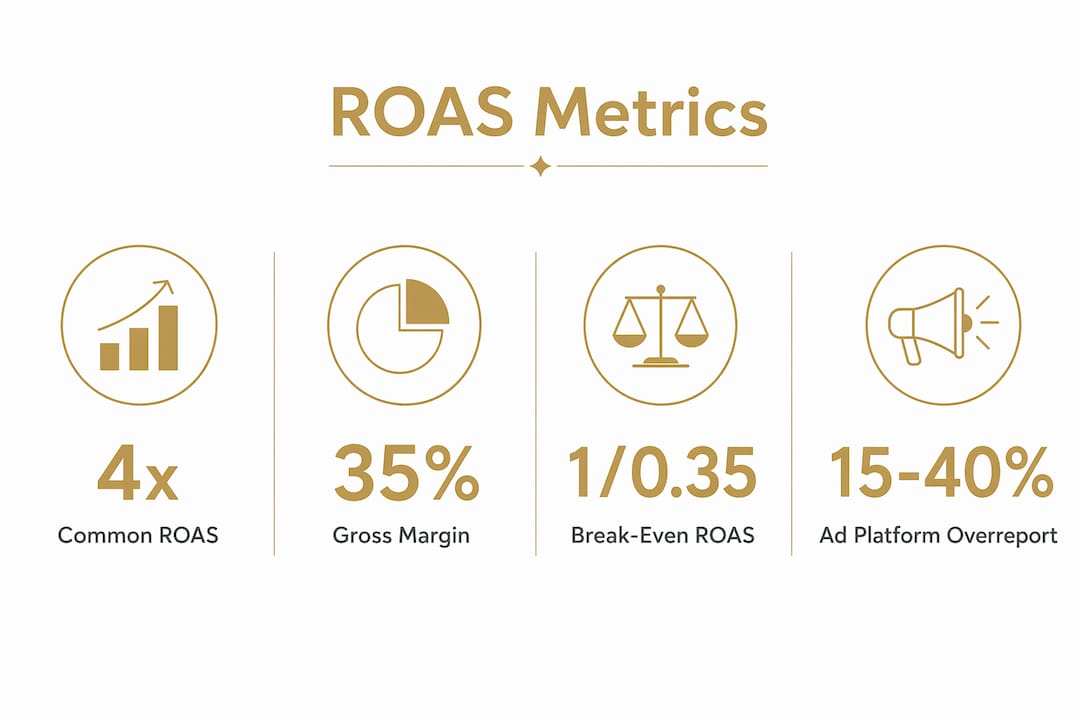
Consider a brand selling a $100 product with a 35% gross margin. That product generates $35 in gross profit before any marketing cost. If the brand spends $20 on ads to sell one unit, the ROAS is 5x. That looks excellent. But after subtracting the $65 in COGS and the $20 in ad spend, the brand nets $15 before overhead. Add fulfillment, returns, and platform fees, and the actual profit may be near zero or negative.
The gap between ROAS and profitability grows wider as brands scale. Higher ad spend does not automatically produce proportional revenue gains, and fixed costs do not disappear.
Key costs that ROAS ignores:
- Cost of goods sold (COGS). The direct cost to produce or source the product.
- Fulfillment and shipping. Often 10–20% of revenue for direct-to-consumer brands.
- Returns and chargebacks. Reduce net revenue but rarely appear in platform-reported ROAS.
- Agency and platform fees. Management fees paid to agencies are sometimes excluded from “ad spend” in dashboard calculations.
- Overhead allocation. Rent, salaries, and software costs that support the advertising operation.
Pro Tip: Build a simple contribution margin model before evaluating any ROAS figure. If you do not know your contribution margin, the ROAS number is decorative.
The difference between ROAS and ROI is not academic. A brand with a 4x ROAS and a 20% contribution margin is losing money on every ad dollar. Understanding gross margin is the prerequisite to reading ROAS correctly.
How to set meaningful ROAS targets based on your contribution margin
A good ROAS depends entirely on the brand’s contribution margin. The break-even ROAS formula is: Break-Even ROAS = 1 / Contribution Margin. A brand with a 40% contribution margin needs a 2.5x ROAS just to break even on ad spend. A brand with a 25% margin needs 4x. These are not targets to beat. They are the floor below which advertising destroys value.

A 4x ROAS is not a universal benchmark. That number circulates widely because it sounds reasonable, but it is meaningless without knowing the margin behind it. A supplement brand with 70% margins can profit at 2x ROAS. A fashion brand with 45% margins needs closer to 3x just to cover ad costs before overhead.
The table below illustrates how break-even ROAS shifts with contribution margin:
| Contribution margin | Break-even ROAS | Interpretation |
|---|---|---|
| 25% | 4.0x | Common for low-margin consumer goods |
| 35% | 2.9x | Typical for mid-margin apparel brands |
| 50% | 2.0x | Common in supplements and digital products |
| 65% | 1.5x | High-margin specialty or luxury goods |
Setting a ROAS target requires three steps:
- Calculate your contribution margin. Subtract variable costs (COGS, fulfillment, payment processing, returns) from revenue, then divide by revenue.
- Apply the break-even formula. Divide 1 by your contribution margin percentage expressed as a decimal.
- Add a profit buffer. Set your target ROAS above break-even to generate actual profit, not just cover costs.
Brands in food and beverage often carry tighter margins than brands in supplements or wellness. Food and beverage benchmarks show contribution margins that frequently require ROAS targets well above the generic 4x rule. Supplements brands, by contrast, often operate at margins where a 2x ROAS is genuinely profitable.
Effective ROAS calculation also requires clear agreement between your ad platform, finance team, and any agencies on how revenue attribution is defined. Discrepancies in attribution windows or revenue definitions cause budgeting errors that compound over time.
What is incrementality and MER, and why do they matter more than ROAS?
Brands should transition from channel-specific ROAS to metrics like incrementality and Marketing Efficiency Ratio (MER) to measure true advertising effectiveness. Platform-reported ROAS is a starting point, not a final answer.
Incremental ROAS measures the additional revenue caused by running ads, not just the revenue that happened while ads ran. The distinction matters because platforms take credit for sales that would have occurred organically. A customer who was already searching for your brand and clicked a branded search ad would likely have purchased anyway. Counting that sale as ad-driven inflates your ROAS and leads to overspending.
Platform-reported ROAS figures are skewed by limited attribution windows and can over-report results by 15–40%, especially on iOS devices. Meta and Google commonly over-report due to attribution windows that overlap with organic behavior. Server-side or analytics-based measurement produces more accurate results.
Key metrics that go beyond standard ROAS:
- Incrementality. Measures revenue caused by ads through holdout tests or geo-based experiments, not just correlated with ad exposure.
- Marketing Efficiency Ratio (MER). Total revenue divided by total marketing spend across all channels. MER captures the full picture, not just one channel’s contribution.
- Blended ROAS. Total revenue divided by total ad spend across all channels. Less precise than MER but easier to calculate quickly.
“For brands over $1M per month in revenue, MER should be the primary efficiency gauge to capture full marketing impact and cost leakage.”: The HQ Digital
MER captures total revenue divided by total marketing spend across all channels and is a more complete indicator of marketing health than channel ROAS alone. A brand running paid social, paid search, and influencer simultaneously cannot evaluate each channel in isolation. MER shows whether the total marketing investment is generating enough revenue to sustain the business.
Pro Tip: Run a holdout test by pausing ads in one geographic market for two weeks. Compare sales in that market against a control market. The difference reveals your true incremental ROAS, not the number your ad platform reports.
ROAS is a starting point, not a verdict
ROAS is one of the most cited metrics in brand marketing and one of the most misused. After years of working directly with consumer brand founders, I have seen the same pattern repeat: a founder sees a 5x ROAS on their Meta dashboard and assumes the business is healthy. Then the P&L tells a different story.
The problem is not the metric itself. ROAS is a clean, fast signal for channel efficiency. The problem is treating it as a profitability verdict. A brand with thin margins and high fulfillment costs can run a 6x ROAS and still lose money at scale. I have seen it happen with DTC brands that scaled fast and hit a wall when the unit economics never worked.
My advice to brand marketers is to build the margin model first, then set the ROAS target. Most brands do it backward. They chase a benchmark they read online, hit it, and wonder why cash flow is still tight. The benchmark means nothing without knowing your own numbers.
The shift to MER and incrementality is not optional for brands at meaningful scale. Platform-reported ROAS is increasingly unreliable due to attribution changes, privacy restrictions, and iOS signal loss. Brands that rely solely on dashboard numbers are making budget decisions on inflated data. Server-side measurement and holdout testing are not advanced tactics reserved for enterprise brands. They are now baseline practices for any brand spending seriously on paid media.
ROAS will remain a useful shorthand. But the brands that grow profitably treat it as one input in a broader financial picture, not the final word.
How Commerce Catalyst helps brands get ROAS right
Knowing your break-even ROAS is one thing. Building the financial model that makes it actionable is another. Commerce Catalyst works directly with consumer brand founders to translate ad spend data into clear profitability analysis.

The DTC Financial Health Assessment gives brand marketers a structured review of their unit economics, contribution margins, and advertising efficiency. Chris Wichert brings hands-on founder experience to every engagement, which means the analysis goes beyond surface-level ROAS figures. If your ad numbers look strong but your cash flow tells a different story, a financial assessment identifies exactly where the gap lives and what to do about it.
Key takeaways
ROAS measures advertising revenue efficiency, but contribution margin determines whether that efficiency translates into actual profit.
| Point | Details |
|---|---|
| ROAS definition | Revenue from ads divided by ad spend, expressed as a ratio, multiple, or percentage. |
| Break-even ROAS formula | Divide 1 by your contribution margin to find the minimum ROAS needed to avoid losses. |
| ROAS vs. ROI | ROAS excludes COGS, fulfillment, and overhead; ROI accounts for all costs and measures true profitability. |
| Platform over-reporting | Ad platforms can over-report ROAS by 15–40%; server-side measurement produces more accurate results. |
| MER as a primary metric | For brands at scale, Marketing Efficiency Ratio across all channels is a more reliable gauge than channel ROAS alone. |
FAQ
What does ROAS mean for brands?
ROAS stands for Return on Ad Spend and is defined as revenue generated from advertising divided by the total amount spent on ads. It tells brands how much revenue each advertising dollar produces.
What is a good ROAS for a brand?
There is no universal good ROAS. A profitable ROAS depends on your contribution margin. Use the formula: Break-Even ROAS = 1 / Contribution Margin to find the minimum your brand needs before setting a target.
How is ROAS different from ROI?
ROAS measures revenue relative to ad spend only, while ROI measures profit relative to all business costs including COGS, overhead, and fulfillment. A strong ROAS can coexist with a negative ROI if margins are thin.
Why does my ad platform show a higher ROAS than my actual results?
Ad platforms over-report ROAS by 15–40% due to attribution window overlaps and iOS privacy restrictions. Server-side analytics tools provide a more accurate picture of true ad-driven revenue.
What is MER and how does it relate to ROAS?
MER, or Marketing Efficiency Ratio, is total revenue divided by total marketing spend across all channels. It gives a more complete view of marketing health than any single channel’s ROAS figure, especially for brands spending across multiple platforms.
Recommended
- Food & Beverage Brand Benchmarks 2026: CAC, Margins, LTV, Profitability | Commerce Catalyst
- Build a Profitability Roadmap for Your Consumer Brand | Commerce Catalyst
- Supplements & Wellness Brand Benchmarks 2026: CAC, Margins, LTV, Profitability | Commerce Catalyst
- Beauty & Skincare Brand Benchmarks 2026: CAC, Margins, LTV, Profitability | Commerce Catalyst