Financial KPIs for brands are quantifiable measures that connect marketing activity directly to financial outcomes, giving business leaders and finance managers a real-time view of profitability, efficiency, and growth. The role of financial KPIs in brands goes far beyond monthly reporting. These metrics function as early-warning indicators that surface cost drifts, customer churn, and margin erosion before they show up in a lagging income statement. Key measures like contribution margin, customer acquisition cost (CAC), and LTV/CAC payback period give finance managers and brand leaders a shared financial language that drives faster, smarter decisions.
What are the most important financial KPIs for consumer brands?
Contribution margin is the single most revealing KPI for a consumer brand. Unlike gross margin, contribution margin accounts for all variable costs and marketing spend, showing the true profit generated per order. Gross margin flatters profitability by ignoring variable fulfillment and marketing costs. Contribution margin strips those away and shows what you actually keep.
CAC is the second pillar. Most brands track blended CAC, which averages acquisition cost across all channels and customers, including repeat buyers. The problem is that blended CAC obscures incrementality. The true cost to acquire a genuinely new customer is often 40–60% higher than blended CAC suggests. That gap directly distorts ROI calculations and can make a money-losing channel look profitable.

Marketing as a percentage of revenue is a third critical efficiency metric. Growth-stage DTC brands typically spend 30–50% of revenue on marketing, while mature brands reduce that to 20–30%. Public DTC brands spent an average of 17.2% of revenue on marketing in 2025, up 80 basis points from the prior year. That upward drift signals rising acquisition costs across the category.
The table below maps the core financial KPIs every consumer brand should track, along with their definitions and target ranges.
| KPI | Definition | Target range |
|---|---|---|
| Contribution margin | Revenue minus all variable costs and marketing spend | 30–50% for DTC brands |
| Blended CAC | Total marketing spend divided by total new customers | Varies by channel mix |
| Incremental CAC | Cost to acquire a genuinely new customer | Benchmark against LTV |
| LTV/CAC payback period | Months to recover CAC from customer lifetime value | Under 12 months preferred |
| Marketing as % of revenue | Marketing spend divided by total revenue | 20–30% for mature brands |
| Repeat purchase rate | Share of customers who buy more than once | Above 30% signals retention health |
Repeat purchase rate deserves more attention than most brands give it. A high repeat rate compresses CAC over time because retained customers cost nothing to reacquire. Brands that ignore retention and focus only on acquisition end up on a treadmill of rising spend with no compounding return.
Pro Tip: Track contribution margin at the product and channel level, not just as a blended average. Half of your marketing spend can destroy value if you only look at totals.
How do financial KPIs bridge marketing and finance functions?
Marketing teams and finance teams operate with fundamentally different priorities. Marketing focuses on growth, reach, and engagement. Finance focuses on margin, cash flow, and return on capital. That gap creates costly disconnects when budgets are set, campaigns are evaluated, and scaling decisions are made.
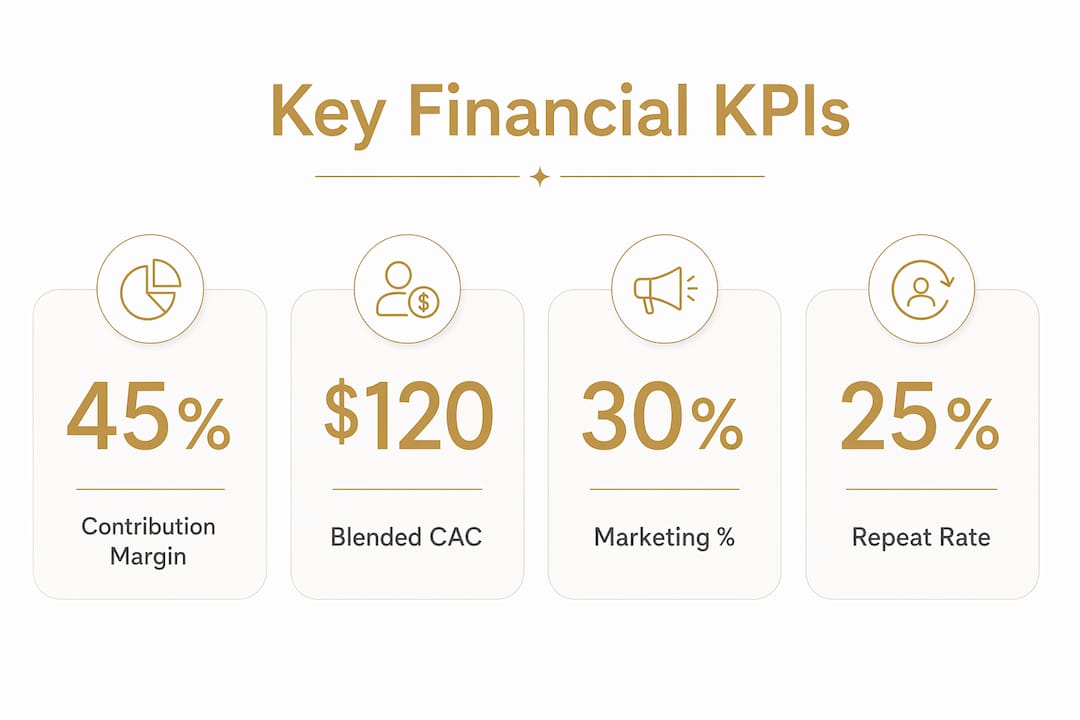
Shared KPIs like blended CAC, contribution margin, and marketing as a percentage of revenue create a common financial language. Brand spend is argued in marketing terms but judged in financial terms. When both teams use the same metrics, the conversation shifts from “did the campaign perform?” to “did the campaign generate profitable demand?”
The most effective brands run monthly KPI reviews that include both marketing and finance leaders. Aligning these teams monthly over shared economic KPIs enables faster scaling and prevents the expensive misalignments that come from quarterly siloed meetings. A campaign that looks successful on click-through rate can look disastrous on contribution margin. Monthly reviews catch that before the budget is renewed.
Common pitfalls that break the marketing-finance connection include:
- Reporting on vanity metrics like impressions, clicks, and follower counts without linking them to revenue or margin
- Setting marketing budgets as a fixed dollar amount rather than a percentage of revenue tied to CAC targets
- Evaluating campaigns only on blended ROAS without accounting for incremental demand generated
- Holding quarterly rather than monthly cross-functional KPI reviews, which delays corrective action by weeks
Pro Tip: Build a single shared dashboard that both marketing and finance update weekly. When both teams own the same numbers, accountability follows naturally.
How to operationalize financial KPIs for real decisions
A KPI system only creates value when it drives action. A KPI system with defined ownership, targets, and decision triggers turns financial metrics from passive reports into active management tools. Without those three elements, a KPI is just a number on a slide.
- Define the metric precisely. Contribution margin means nothing if two people calculate it differently.
- Establish ownership. One person is accountable for each KPI, not a committee.
- Fix a target. A KPI without a target is a data point, not a performance signal.
- Integrate the KPI into regular review cycles at the right frequency.
- Note the decision triggers. What action does a 5% drop in contribution margin require?
- Evolve the KPI as the business scales. Early-stage and mature-stage brands need different leading indicators.
Monitoring frequency matters as much as the KPI itself. Daily monitoring suits operational metrics like ad spend and order volume. Weekly monitoring fits CAC and conversion rates. Monthly monitoring is appropriate for contribution margin, LTV/CAC payback, and marketing as a percentage of revenue. Mixing these frequencies creates noise and leads to reactive decisions based on short-term fluctuations.
Scenario analysis adds another layer of value. Top-performing consumer brands model campaigns before launch to predict profitability and guide scale decisions. Running three scenarios, conservative, base, and aggressive, against contribution margin and CAC targets tells you in advance which conditions make a campaign worth scaling and which make it worth cutting.
Connecting KPIs to their underlying drivers is the final step. When contribution margin drops, the cause is either price, variable cost, or marketing spend. Knowing which driver moved first tells you exactly where to act. A founder financial dashboard that maps KPIs to their drivers turns a warning signal into a specific corrective action.
What role do financial KPIs play in long-term brand investment?
Brand marketing investments are notoriously hard to justify in financial terms. The payback period is longer, the attribution is messier, and the outcomes are harder to model than performance marketing. That difficulty leads many brands to underinvest in brand building and over-rotate toward performance channels.
The financial case for brand investment rests on the compound economic profit loop. A strong brand creates incremental demand, improves cash flows and margins, and enables reinvestment in future growth. That loop compounds over time. A brand with strong awareness and loyalty generates repeat purchases at near-zero acquisition cost, which compresses blended CAC and expands contribution margin simultaneously.
The table below contrasts short-term and long-term marketing KPIs and their financial implications.
| KPI type | Example metrics | Financial implication |
|---|---|---|
| Short-term performance | ROAS, blended CAC, conversion rate | Immediate revenue signal, high attribution confidence |
| Long-term brand | Incremental demand, repeat purchase rate, brand awareness index | Sustained margin improvement, lower future CAC |
| Efficiency bridge | Marketing as % of revenue, contribution margin | Connects both time horizons to profitability |
Research from Brand Finance shows that effective consumer brands allocate roughly 60% of marketing spend to brand building and 40% to performance marketing. That split sustains long-term awareness while maintaining short-term revenue generation. Brands that invert that ratio often see short-term revenue hold steady while brand equity and repeat purchase rates quietly erode.
Rebalancing spend from performance to brand marketing requires KPI evidence. Incremental CAC trending upward is a clear signal that performance channels are saturating. When the cost to acquire a genuinely new customer rises faster than LTV, shifting budget toward brand building is the financially sound response. That decision requires the profitability roadmap discipline to model the transition before committing capital.
Effective brands also manage cash conversion cycles to fund marketing spend without external capital. Negotiating supplier payment terms and using customer prepayments to fund marketing spend internally reduces financial risk when scaling. That operational discipline shows up directly in cash flow KPIs and gives brands more room to invest in brand building without straining liquidity.
Key Takeaways
Financial KPIs for brands create accountability, align marketing and finance teams, and turn brand investment into a measurable, repeatable growth engine.
| Point | Details |
|---|---|
| Contribution margin is the core KPI | Track it at the product and channel level to avoid masked losses from blended averages. |
| Incremental CAC beats blended CAC | True new-customer acquisition cost runs 40–60% higher than blended figures, distorting ROI. |
| Monthly cross-functional reviews matter | Aligning marketing and finance monthly over shared KPIs prevents costly scaling mistakes. |
| Brand spend needs financial framing | Link brand investment to incremental demand and the compound economic profit loop to justify budget. |
| KPIs require ownership and triggers | A metric without a named owner, a target, and a decision trigger is just a report. |
Financial clarity for consumer brands that want to scale
Consumer brands that want to move from revenue growth to profitable growth need more than a dashboard. They need a structured process that connects KPIs to decisions and decisions to outcomes.

Commerce Catalyst’s DTC Financial Health Assessment is built for exactly that. The assessment identifies the specific financial constraints holding your brand back, from contribution margin gaps to CAC inefficiencies, and translates them into a clear set of priorities. Chris Wichert works directly with your team to build the KPI system and review cadence your brand needs to scale without guessing. If you want financial clarity that drives real decisions, the assessment is the right starting point.
FAQ
What are financial KPIs for brands?
Financial KPIs for brands are quantifiable metrics that link marketing activity and operational decisions to financial outcomes like profit, cash flow, and return on investment. Key examples include contribution margin, CAC, LTV/CAC payback period, and marketing as a percentage of revenue.
Why is contribution margin more useful than gross margin for DTC brands?
Contribution margin subtracts all variable costs and marketing spend from revenue, showing the true profit per order. Gross margin excludes marketing and fulfillment costs, which flatters profitability and hides the real cost of customer acquisition.
How often should brands review financial KPIs?
Daily monitoring suits operational metrics like ad spend and order volume. Weekly monitoring fits CAC and conversion rates. Monthly reviews are appropriate for contribution margin, LTV/CAC payback, and marketing as a percentage of revenue, and should include both marketing and finance leaders.
What is the difference between blended CAC and incremental CAC?
Blended CAC divides total marketing spend by total customers acquired, including repeat buyers. Incremental CAC measures the cost to acquire a genuinely new customer and runs 40–60% higher than blended CAC, making it the more accurate signal for ROI decisions.
How do financial KPIs support long-term brand investment?
Financial KPIs like incremental demand, repeat purchase rate, and contribution margin connect brand marketing spend to the compound economic profit loop, showing how brand investment improves margins and lowers future acquisition costs over time.
Recommended
- How to Position Your Brand for Strategic Investment | Commerce Catalyst
- Pet Care Brand Benchmarks 2026: CAC, Margins, LTV, Profitability | Commerce Catalyst
- Food & Beverage Brand Benchmarks 2026: CAC, Margins, LTV, Profitability | Commerce Catalyst
- Beauty & Skincare Brand Benchmarks 2026: CAC, Margins, LTV, Profitability | Commerce Catalyst