
Repeat purchase rate is the share of your customers who bought more than once in a given window, calculated as customers with two or more orders divided by total unique customers. It matters because it is the earliest reliable signal of whether your acquisition spend actually compounds, since repeat customers routinely drive more than half of annual revenue for brands that get retention right. The number is meaningless, though, without a stated time window attached to it.
TL;DR:
- The repeat purchase rate varies significantly by category, with consumables exceeding 40% and electronics often below 15%, making benchmarking critical.
- Use a proper 90-day or 365-day window, differentiate between cohort and blended metrics, and avoid counting orders instead of customers to prevent inflated loyalty figures.
- Improving first-order experience and implementing targeted post-purchase flows can increase repeat rates by three to six percentage points within a quarter.
- Regularly track cohort-based repeat purchase rates, revenue share of returning customers, and integrate RPR into lifetime value and profitability analyses for better insights.
- Diagnosing retention issues requires upstream product and operations fixes before marketing tactics, with cohesion between product development and loyalty strategies essential.
Table of Contents
- How to Calculate Repeat Purchase Rate at the Customer Level
- A Worked Example: Turning Raw Counts Into a Real Number
- Repeat Purchase Rate Benchmarks by Category (and Why Averages Lie)
- The Calculation Mistake That Inflates Every Loyalty Number
- Tactics That Actually Move Repeat Purchase Rate
- Tracking and Reporting Repeat Purchase Rate the Right Way
- How We Diagnose a Weak Repeat Purchase Rate
- When You Need Help Fixing the Number, Not Just Tracking It
- Sources
How to Calculate Repeat Purchase Rate at the Customer Level
The formula itself is simple. Repeat purchase rate equals the number of customers with two or more orders, divided by the total number of unique customers in the window, multiplied by 100. The complexity lives in getting clean counts out of your data.
Here is how to pull it correctly:
- Pick your window. Ninety days works for consumables and fast fashion; 365 days fits categories with longer replenishment cycles like furniture or electronics. The window changes the answer dramatically, so lock it in before you calculate anything.
- Pull unique customer IDs, not order IDs, from your platform export or BI tool. Deduplicate by email or customer ID, never by order number.
- Count how many of those unique customers placed two or more orders inside the window.
- Divide repeat customers by total unique customers, then multiply by 100 to get a percentage.
A 90-day window will almost always produce a lower number than a 365-day window for the same customer base, simply because there is less time for a second purchase to happen. Report both if you can, and always label which one you are showing.
A Worked Example: Turning Raw Counts Into a Real Number
Say your store had 4,000 unique customers over the trailing 12 months. Of those, 960 placed a second order or more inside that same window.
| Metric | Value |
|---|---|
| Total unique customers | 4,000 |
| Customers with 2+ orders | 960 |
| Repeat purchase rate | 24% |
| Window used | 365 days |
That 24% sits inside the commonly cited healthy range, but “healthy” depends entirely on category. The same number for a coffee subscription business would signal a real churn problem. Always attach the window when you report the figure. A 24% rate calculated over 90 days means something very different than the same number over a full year.
Repeat Purchase Rate Benchmarks by Category (and Why Averages Lie)
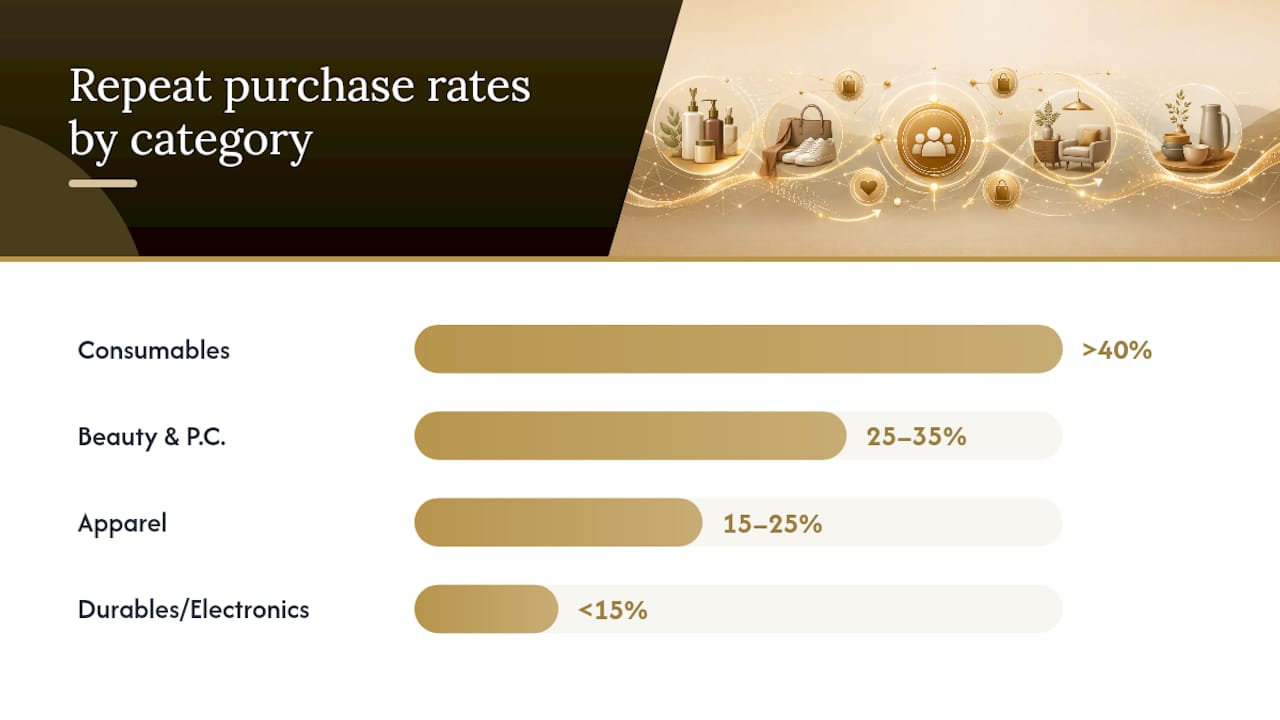
A commonly cited “good” repeat purchase rate lands around 20 to 30 percent, but that range only holds as a rough starting point, not a target every brand should chase.
Vertical matters more than most dashboards let on:
- Consumables and food or beverage brands often see medians above 40%, since the product itself creates a built-in reorder cycle.
- Beauty and personal care typically lands in the 25 to 35% range, driven by predictable depletion timing.
- Apparel tends to run lower, often 15 to 25%, with heavy seasonality skewing any single-month read.
- Durable goods and electronics frequently sit below 15%, because the products themselves do not need replacing often.
Benchmark note: category-specific medians for repeat purchase rate vary widely, and a platform-wide average blends every one of those categories into a single misleading number. Comparing your beauty brand against a Shopify-wide average tells you almost nothing useful. Compare against direct category peers, then track your own cohort trend quarter over quarter. A beauty brand’s own benchmark set will tell you more than any blended platform figure ever could.
The Calculation Mistake That Inflates Every Loyalty Number
Most inflated repeat purchase rates trace back to one error: counting orders instead of customers.
- Order-level miscalculation. Dividing repeat orders by total orders instead of repeat customers by total customers overstates loyalty, sometimes badly, because a handful of frequent buyers can generate a large share of total orders while most customers never come back.
- Acquisition spikes distort the trend. A big paid-media push floods your denominator with brand-new customers who have not had time to reorder yet, dragging the blended rate down even though existing customers are behaving normally.
- Window drift breaks comparisons. Switching between 90-day and 365-day windows month to month makes trend lines meaningless.
- Validation fix. Break the number out by acquisition cohort and by channel, then compare the cohort-level rate against your blended company-wide figure.
Pro Tip: If your blended repeat purchase rate looks strong but your cohort-by-cohort breakdown shows declining rates for every recent acquisition month, you have a retention problem masked by growth. Fix the masking before you trust the headline number.
Tactics That Actually Move Repeat Purchase Rate
Not every retention tactic deserves equal attention. Sequence these from cheapest and fastest to most structural.
- Fix the first-order experience first. Shipping delays, confusing packaging, or a rocky unboxing moment kill second-purchase intent before any email campaign gets a chance to work.
- Build a post-purchase flow. Onboarding emails, cross-sell recommendations timed to expected reorder windows, and simple check-ins outperform generic newsletter sends.
- Automate replenishment reminders. For any consumable product, a reorder nudge timed to typical depletion is often the single strongest lifecycle email you can build.
- Design a loyalty program that pays for itself. Reward tiers that favor repeat behavior over one-time discounts protect margin better than blanket promo codes.
- Run segmented win-back campaigns. Save the steepest discounts for customers who have gone quiet the longest; reserve softer incentives for recently lapsed buyers.
- Consider product and SKU changes when the ceiling is structural. Introducing a consumable companion product or a bundle can move repeat purchase rate more than any lifecycle email ever will, because it changes the underlying reason a customer needs to come back.
Pro Tip: A focused post-purchase and replenishment program typically moves repeat purchase rate by three to six percentage points in a quarter. If you need more than that, the fix usually lives in the product line, not the inbox. For tactical detail on execution, proven retention strategies covers the channel-level playbook well.
Tracking and Reporting Repeat Purchase Rate the Right Way
Build these into a recurring report, not a one-off pull:
- Cohort RPR, segmented by acquisition week or month, so you can see whether recent cohorts are performing better or worse than older ones.
- RPR by first-purchase SKU, which often reveals that certain entry products create loyal customers while others attract one-time deal seekers.
- Repeat customer revenue share, showing what portion of total revenue comes from returning buyers versus new ones.
- RFM segments (recency, frequency, monetary value) layered on top of RPR for a fuller loyalty picture.
Fast-moving categories like consumables or beauty should review this monthly; longer-cycle categories like furniture or electronics can review quarterly without losing signal. Shopify’s own guidance on loyalty analytics recommends pairing RPR with average order value, customer acquisition cost, and lifetime value, since RPR is often the fastest-moving input into any LTV model. A customer profitability framework ties these together into a single view of whether your retention gains are actually paying for your acquisition costs.
How We Diagnose a Weak Repeat Purchase Rate
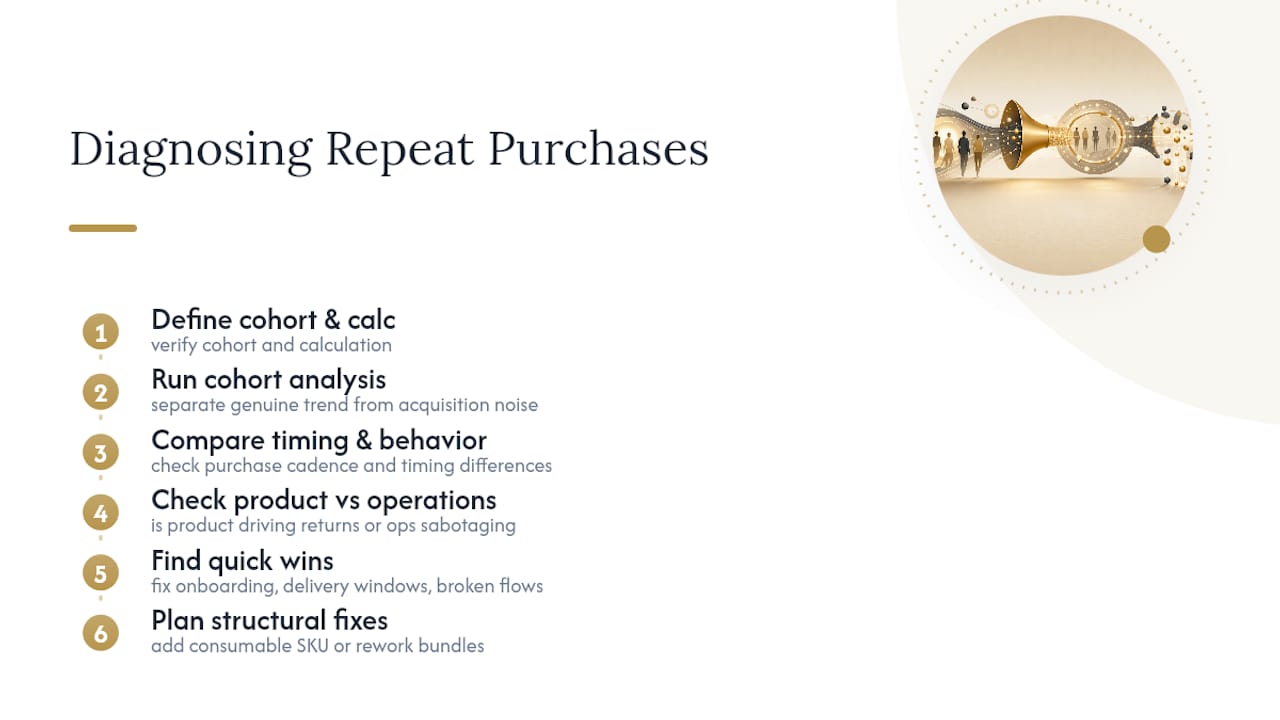
Most founders who come to us with a retention problem have already tried the obvious fixes: another email flow, another discount code. The real issue is usually upstream of marketing entirely.
We start by isolating the binding constraint. Is the product itself creating a reason to return, or is post-purchase operations quietly sabotaging a good product? A late shipment or a confusing return process will suppress repeat purchase rate no matter how good your win-back sequence is. Quick wins, like fixing a broken onboarding email or tightening a delivery window, can show up in the number within a quarter. Structural fixes, like adding a consumable SKU or restructuring a bundle, take longer but move the ceiling, not just the floor. A cohort analysis framework is usually the first tool we reach for, because it separates a genuine trend from noise created by a recent acquisition push.
When You Need Help Fixing the Number, Not Just Tracking It
If your repeat purchase rate has been flat for two quarters and you cannot tell whether the problem is your product, your post-purchase flows, or your unit economics, a diagnostic beats another round of guessing. Commerce Catalyst’s DTC Financial Health Assessment evaluates the retention levers alongside the profitability math, so you get a prioritized action plan instead of a list of generic tactics you have already tried.

Brands that go through the assessment typically walk away with a clearer picture of which constraint is actually binding growth, whether that is a lifecycle gap, a margin problem hiding inside your loyalty program, or a product line that needs a consumable companion SKU. For teams that already know the diagnosis and need an execution partner to move fast, the 90-Day Profit Sprint turns those priorities into tested changes inside a single quarter. Start with the financial assessment to find out exactly where your repeat purchase rate is leaking margin, and where it is not.
Sources
- Repeat Purchase Rate | Formula + Calculator
- What is a good repeat purchase rate in marketing?
- Repeat Purchase Rate: Formula, Benchmarks & How to Improve