
Price pack architecture (PPA) is the disciplined design of pack sizes, formats, and price points so each shopper occasion and channel pays its fair share, raising margin and protecting share without touching the product itself. It works by treating your portfolio as a ladder of price-per-unit rungs rather than a pile of unrelated SKUs. Get the ladder right, and you recover margin dollars that discounting and cost-cutting can never reach. The rest of this guide gives you the framework and a one-quarter checklist to start.
TL;DR:
- Most PPA issues stem from inversions and cliffs in the pack price curve that cause margin erosion or cannibalization of demand.
- Achieving consistent step ratios and preventing larger packs from costing more per unit are essential for a healthy pack-price ladder.
- A thorough audit requires at least 12 months of data, including sales volume, trade spend, and pack-level costs, to inform effective adjustments.
- Pilot testing should match control stores on baseline variables and exclude promotional periods to accurately measure pack performance.
- Effective governance involves clear ownership, guardrails for pricing, and regular reviews to maintain a robust, adaptable pack architecture.
Table of Contents
- What Is Price Pack Architecture (And What It Isn’t)?
- Why PPA Matters for Margin, Share, and Shopper Occasions
- Building Blocks: The Pack-Price Ladder, Channel Roles, and the Value Slope
- The 7-Step PPA Framework to Diagnose, Design, Test, and Govern
- Data, Measurement, and the Minimum Fact Base You Need
- How to Design Pilots and Read the Signals They Produce
- Governance, Ownership, and Guardrails to Protect Margin
- Operational and Retailer Implementation Challenges, With Mitigations
- Quick Audit: 10 Checks to Run This Quarter
- Practitioner Perspective and Tools: Commerce Catalyst’s Diagnostic Approach
- When to Prioritize PPA Over Innovation
- Fix Your Pack Economics Before You Fix Anything Else
- Sources
What Is Price Pack Architecture (And What It Isn’t)?
PPA is the deliberate structuring of a brand’s pack sizes, formats, and price points across channels so that each one matches a specific shopper occasion. A 12-ounce single serves a convenience-store impulse buy. A 48-ounce jug serves the once-a-month stock-up trip at a warehouse club. Get the spacing between those rungs wrong, and you leave margin on the table or push shoppers toward whichever pack is accidentally underpriced.
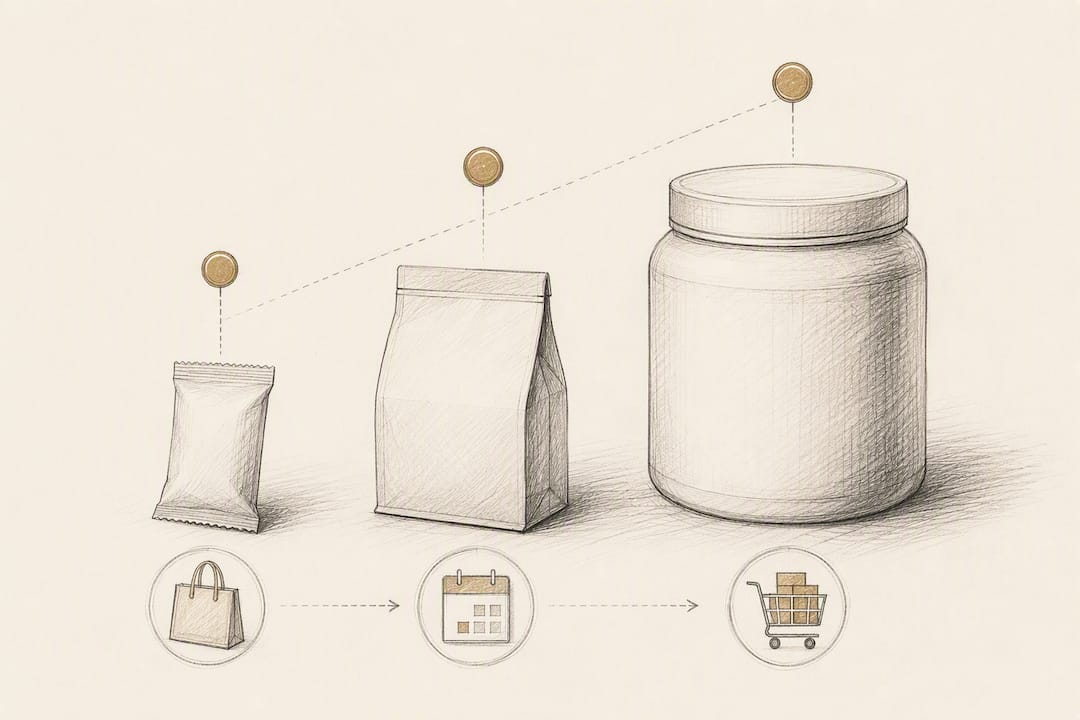
That distinction matters because PPA gets confused with its uglier cousin, shrinkflation: shrinking a pack while holding the price steady, hoping nobody notices. Analysis from the Groundwork Collaborative found shrinkflation contributed a measurable share of inflation in certain grocery categories, and that kind of quiet downsizing is exactly what erodes shopper trust. Real PPA is transparent. You’re not hiding a smaller can inside the same box, you’re building an intentional set of options and letting shoppers self-select the one that fits their occasion. As the New York Times has explained, that means new portion-controlled formats and channel-specific pack sizes designed around how people actually shop, not around what a company can quietly get away with removing.
The vocabulary that makes PPA analytical rather than intuitive centers on three ideas:
- Price-per-unit: the equivalized cost per ounce, count, or gram across every pack in the lineup
- Ladder step ratio: how much price-per-unit changes as you move from a small pack to the next size up
- Inversion: when a larger pack costs more per unit than a smaller one, which quietly trains shoppers to buy down
Why PPA Matters for Margin, Share, and Shopper Occasions
Get the ladder right and you’re not choosing between margin and volume. General Mills’ PPA program is built around what the company calls a Triple Win: the manufacturer earns more margin, the retailer sees better category economics, and the shopper gets a pack that actually fits their occasion instead of a one-size-fits-none default.
Roland Berger’s consulting analysis of FMCG pricing found that strategic PPA initiatives can materially improve EBIT when layered with other revenue growth management levers, rather than treated as a standalone price increase.
Done poorly, PPA cannibalizes itself. Introduce a mid-size pack priced too close to your best seller, and you’ve just given shoppers a discount they didn’t ask for. Done well, it opens genuinely new occasions instead of splitting existing demand. A brand should prioritize a PPA review the moment it notices three symptoms together: flat category share despite steady marketing spend, a portfolio heavily concentrated with volume on just one or two SKUs, and a retailer partner asking for a different price point than the brand currently offers.
Building Blocks: The Pack-Price Ladder, Channel Roles, and the Value Slope
Every PPA project starts with the same diagnostic exercise: equivalizing price to a common unit (per ounce, per count, per load) across every pack you sell, then plotting that curve by channel. Revology Analytics’ framework for engineering pack-price ladders treats this curve as the single most revealing artifact in the entire exercise, because inversions and cliffs that are invisible in a spreadsheet jump out instantly on a chart.
A healthy ladder has three properties worth checking for directly:
- Consistent step ratios: each size increase should reduce price-per-unit by a similar, deliberate percentage, not an erratic one
- No inversions: larger packs should never cost more per unit than smaller ones in the same channel
- No cliffs: a jump between two adjacent packs that’s so large shoppers have no reason to trade up
Channel role matters as much as pack size. A convenience-store single serve exists for trial and impulse. A club-store multipack exists for stock-up. A DTC subscription bundle exists for habitual replenishment and deserves its own pricing logic entirely, since the occasion (and the absence of retailer margin) changes the math.
Pro Tip: Map psychological price ceilings by channel before you touch pack sizes. Thresholds like $0.99 or $4.99 change demand response in ways that a pure per-unit calculation misses, so a technically “correct” price point can still underperform if it crosses a ceiling shoppers have been trained to expect.
The 7-Step PPA Framework to Diagnose, Design, Test, and Govern
Treating PPA as a structured, sequential project rather than an ad hoc price adjustment is what separates the brands that recover real margin from the ones that just annoy their retailers. Revology Analytics lays out a version of this sequence that maps closely to how most successful RGM teams actually operate.
-
Audit the ladder by channel and banner. Pull every active SKU, equivalize the price-per-unit, and plot the curve separately for grocery, club, convenience, and ecommerce. The same brand can look healthy in one channel and badly inverted in another.
-
Quantify pack-level economics, including trade and freight. A pack that looks profitable at list price can lose money once you load in trade spend, freight-to-retailer, and case-pack inefficiencies. This step is where finance and sales need to sit at the same table as marketing.
-
Measure willingness to pay and elasticity. Combine scanner or point-of-sale elasticity models with direct survey work, Van Westendorp price sensitivity meter, Gabor-Granger, or choice-based conjoint, to triangulate how much room exists at each rung.
-
Design a target ladder and channel corridors. Set the intended price-per-unit and step ratio for each pack, and define acceptable price ranges (corridors) by channel so field sales and ecommerce teams have flexibility without breaking the architecture.
-
Simulate and pilot. Model the projected mix shift and margin impact before launch, then test in a controlled subset of stores or a limited ecommerce cohort to confirm the model against real purchase behavior.
-
Set governance guardrails and decision rights. Decide who can approve a price exception, who owns the ladder long-term, and what per-unit minimums nobody is allowed to breach without sign-off.
-
Measure with price-volume-mix (PVM) analysis and schedule quarterly reviews. A ladder is never finished. A simple architecture reviewed every quarter consistently outperforms a theoretically perfect one that’s never revisited, because input costs, competitor moves, and retailer resets all shift the ground underneath it.
Data, Measurement, and the Minimum Fact Base You Need
You can’t design a defensible ladder on instinct or a single retailer’s scan data. The minimum viable dataset for a serious PPA project includes at least 12 months of scanner or POS data by SKU and channel, sell-in volumes and trade spend by account, and pack-level cost of goods sold that separates packaging, freight, and ingredient cost.
Elasticity models built on that transactional data tell you what shoppers actually did. Survey-based methods, conjoint analysis, Gabor-Granger, and Van Westendorp, tell you what they say they’d do, which matters most when you’re testing a pack size or format that doesn’t exist yet and has no transaction history to model.
The strongest fact base blends both:
- Transactional elasticity for existing packs, where real purchase behavior already exists
- Survey-based willingness to pay for new formats or price points with no sales history
- Trade and freight-adjusted margin at the pack level, not just the brand level
Reviewing your own price elasticity by SKU before you touch the ladder tells you which packs can absorb a price move and which ones are already stretched thin.
How to Design Pilots and Read the Signals They Produce
A pilot only tells you the truth if the control group is carefully matched. Match test and control stores or ecommerce cohorts on baseline volume, demographic mix, and competitive intensity, and run long enough to cover at least one full purchase cycle for the category.
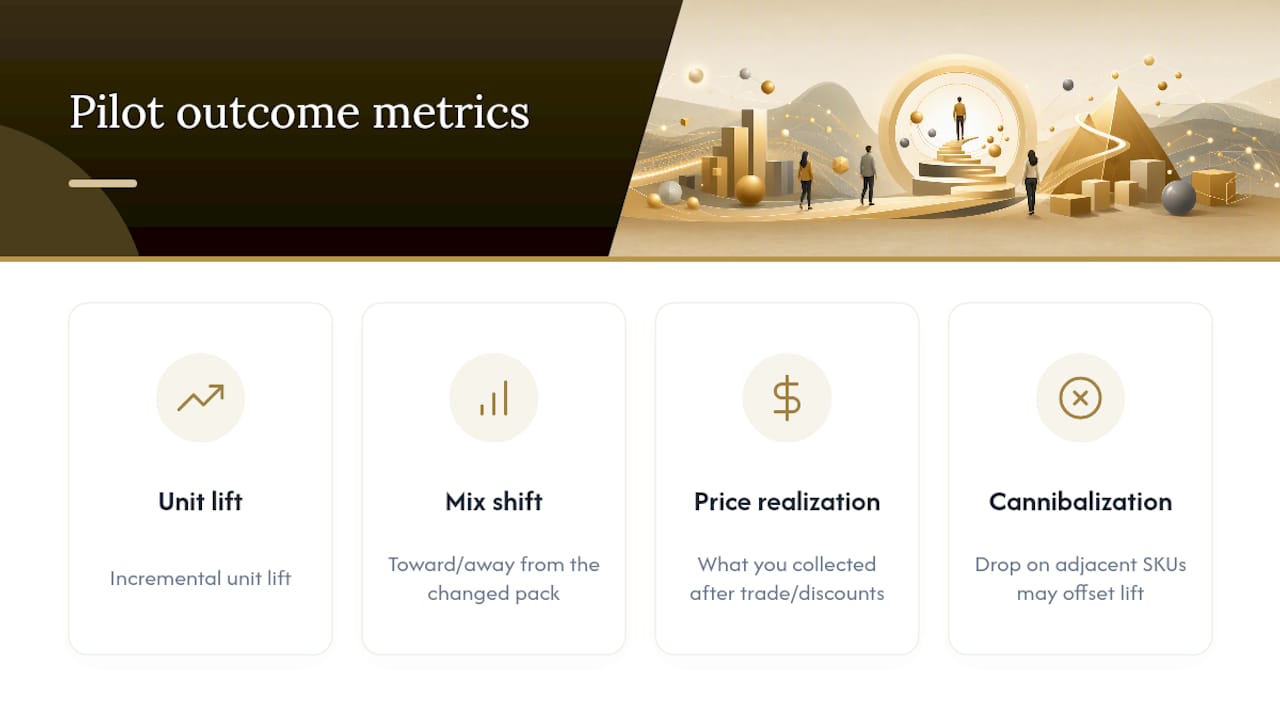
Watch four outcome metrics, not just top-line sales: incremental unit lift, mix shift toward or away from the pack you changed, price realization (what you actually collected after trade and discounts), and cannibalization of adjacent SKUs. A pilot that shows strong lift on the new pack but a bigger drop on the SKU next to it hasn’t created growth, it’s just moved the same demand sideways.
Pro Tip: Strip out promotional weeks and seasonal spikes before you read pilot results. A pack that “wins” during a holiday promotion window tells you almost nothing about how it performs at everyday shelf price.
Governance, Ownership, and Guardrails to Protect Margin
Someone has to own the ladder, or it drifts back to chaos within two quarters. General Mills assigns PPA ownership to brand teams and layers in a formal decision framework to keep pricing calls from becoming a free-for-all across regions and channels. Centralized RGM teams work too, provided they have real authority, not just an advisory role that sales ignores under quarter-end pressure.
Whichever model you pick, build in guardrails before the first exception request lands:
- Per-unit price minimums that no regional team can undercut without formal sign-off
- Channel corridors defining the acceptable price range for each pack by retail format
- Promotional floors preventing a deep discount from accidentally creating a permanent inversion
Pair those guardrails with a clear exception process and a quarterly review cadence, and the ladder holds up under real-world pressure instead of eroding one side deal at a time.
Operational and Retailer Implementation Challenges, With Mitigations
The math can be perfect and the project still stalls at the loading dock. Packaging suppliers often have minimum order quantities that make a new intermediate pack size uneconomical below a certain volume threshold, and production feasibility needs to be checked early, not after the ladder is designed on paper.
Retailer buy-in is its own separate battle. Selling in a new pack size means proving the Triple Win concretely with category-level data, not just brand-level projections, since the buyer’s job is protecting their shelf economics, not yours.
- Lead with category math, showing how the new pack grows total category dollars, not just your brand’s share
- Rationalize before you add, discontinuing low-velocity SKUs that already drag down shelf productivity rather than adding a pack on top of clutter
- Set discontinuance criteria upfront: velocity thresholds, minimum margin contribution, and a fixed review date, so underperforming packs get pulled instead of lingering for years
Quick Audit: 10 Checks to Run This Quarter
You don’t need a six-month consulting engagement to find your first wins. Most brands can surface real margin recovery opportunities with a focused internal audit over a few weeks.
- Pull every active SKU and its current price by channel
- Equivalize each pack to price-per-unit (per ounce, count, or load)
- Plot the ladder curve separately for each major channel
- Flag any inversion where a bigger pack costs more per unit than a smaller one
- Flag any cliff where the jump between adjacent packs exceeds your typical step ratio
- Pull pack-level cost of goods, including trade spend and freight
- Rank flagged issues by margin-dollar opportunity, not just percentage
- Check for at least one loss-making rung once trade and freight are included
- Draft per-unit minimums and channel corridors for the worst three offenders
- Set a fixed date next quarter to re-run the full audit
Reviewing your category’s profitability benchmarks alongside this audit helps you gauge whether a flagged issue is a real outlier or just normal variance for your category.
Practitioner Perspective and Tools: Commerce Catalyst’s Diagnostic Approach
Chris Wichert built Commerce Catalyst after running the same margin diagnostics as a brand founder himself, which is why the approach leans hands-on rather than theoretical. The DTC Financial Health Assessment applies the same pack-level economic thinking covered above: pulling apart trade spend, freight, and cost of goods by SKU to find exactly where a portfolio is leaking margin.
Commerce Catalyst’s DTC Unit Economics Calculator gives founders a fast first look at which packs or bundles are underpricing themselves before committing to a full ladder redesign. For brands generating $5 million to $75 million in revenue, that first look often surfaces the same inversions and cliffs described earlier in this guide, just buried inside a P&L instead of a chart.
When to Prioritize PPA Over Innovation
Prioritize PPA when your category is stable and your problem is realization, not demand: flat share, margin bleeding through trade spend, or a ladder that hasn’t been touched in years. Innovation and reformulation earn priority instead when the underlying product no longer fits the occasion at any price, or when a real white space exists that no pack size can solve.
Fix Your Pack Economics Before You Fix Anything Else
Commerce Catalyst is the direct alternative to guessing your way through a pricing overhaul: instead of hiring a full RGM consultancy for a six-figure engagement, you get a founder-experienced advisor who has personally sat where you’re sitting, running the same pack-level math on real P&Ls.

The DTC Financial Health Assessment picks up right where the audit checklist above leaves off, tracing every flagged inversion or cliff back to its actual dollar impact on your margin, using the same DTC Unit Economics Calculator referenced earlier. If you need faster movement, the 90-Day Profit Sprint is built specifically for brands that have already found the leak and need a scoped, fast-moving engagement to close it. Book a diagnostic call and bring your current pack list. That single conversation usually surfaces which rungs on your ladder are costing you the most, before you spend another quarter guessing.
Sources
- Price Pack Architecture: The 7-Step Guide to Engineering Profitable Pack-Price Ladders
- Price Pack Architecture: New York Times explainer
- Big profits in small packages (Groundwork Collaborative)