Freight cost allocation is the process of distributing transportation expenses across the products, shipments, or customers that actually generated them, rather than dumping every freight invoice into one overhead bucket. Get it right and you know your true landed cost, your real gross margin by SKU, and which customers are quietly eating your profit. Get it wrong and every pricing decision you make afterward is built on a number that lies.
TL;DR:
- Using lane-based average allocation often provides a practical balance for growing companies over perfect direct assignment systems.
- Including all relevant freight costs, such as accessorials, duties, and customs fees, is essential for accurate per-unit cost calculations.
- Proper separation of freight-in and freight-out costs in accounting ensures correct inventory valuation and profit reporting.
- Fixing freight allocation errors on high-variability lanes can significantly improve gross margin accuracy without overhauling systems.
- Regular reconciliation, documentation, and policy consistency are key to preventing common freight allocation breakdowns.
Table of Contents
- What Freight Cost Allocation Means in Practice
- Choosing an Allocation Method: Precision vs. Practicality
- Freight Cost Per Unit: The Formula and a Worked Example
- Freight-In vs. Freight-Out: Why the Accounting Split Matters
- Setting Up Allocation Rules in Your ERP or Accounting System
- Where Freight Allocation Breaks Down (and How to Prevent It)
- When Allocation Changes the Decision, Not Just the Number
- Commerce Catalyst’s Allocation Checklist for Founders
- What I’d Fix First If I Were You
- Get Help Turning Freight Data Into Margin Decisions
- Sources
What Freight Cost Allocation Means in Practice
Allocation runs on a basis, meaning the metric you use to split a shared freight bill across multiple orders or SKUs. Common bases include weight, volume, unit count, declared value, shipping lane, or a direct order/line assignment when the data supports it.
Underneath that basis sits a rule: do you allocate planned cost or actual invoiced cost, and what happens when an invoice doesn’t match a purchase order? Oracle’s Transportation Management documentation describes this as voucher matching with fallback logic, where the system tries an exact match first, then falls back to broader qualifiers like carrier or lane if no line-level match exists. A few terms come up constantly once you start building rules:
- Accessorials: extra carrier charges like liftgate service, detention, or residential delivery fees, often excluded from allocation by mistake
- Shipment group: a batch of orders consolidated onto one truck or container for cost-splitting purposes
- Order base line: the specific order or line item a cost gets attributed to
- Chargeable weight: the greater of actual weight or dimensional (volumetric) weight, which is how carriers price mixed freight
Choosing an Allocation Method: Precision vs. Practicality
The method you pick depends on how much data discipline your operation can sustain, not on which one is theoretically best. Four approaches cover almost every situation a growing brand runs into.
- Direct assignment. Each shipment’s actual freight cost gets tied to the exact order or SKU it moved. This is the most accurate method available, but it demands clean carrier invoices matched to individual orders, which most small logistics teams don’t have the bandwidth to maintain.
- Lane-based average. You calculate an average cost per shipping lane (say, Los Angeles to Chicago) and apply it to every order that traveled that route. Nuvocargo’s breakdown of lane-level allocation frames this as the practical middle ground for mid-market shippers who can’t match every invoice line by line but still want cost data that reflects reality.
- Weight, volume, or value allocation. You split the total freight bill proportionally based on each order’s share of total weight, cubic volume, or dollar value. It’s fast to set up and terrible at precision, since a light, bulky item and a dense, cheap item get treated identically per pound.
- Chargeable weight. For air and ocean freight especially, using the greater of actual or dimensional weight tends to mirror how carriers actually bill you, according to Pulsify’s freight cost per unit guidance.
Pro Tip: If you’re choosing between a lane average and a “perfect” direct-assignment system nobody maintains past month three, take the lane average. A consistently applied imperfect method beats an abandoned precise one.
Freight Cost Per Unit: The Formula and a Worked Example
The core formula behind most allocation methods looks like this:
Per-unit freight cost = (Order’s metric ÷ Total shipment metric) × Total base cost
Where “metric” is whatever basis you chose (weight, volume, units) and “base cost” is the full freight bill, not just the linehaul rate. Base cost should include:
- Carrier linehaul charges
- Fuel surcharges
- Accessorials (liftgate, detention, residential fees)
- Duties and customs fees on inbound freight
- Origin and destination handling charges
Here’s a worked example. Using unit count as the basis, SKU A absorbs $1,440 of freight ($2,400 × 0.60), or $0.80 per unit. SKU B absorbs $960, or $0.80 per unit as well, since both SKUs share the same per-unit weight profile in this case. Swap in actual weight instead of unit count and those numbers can shift meaningfully if one SKU is heavier per unit than the other.
One frequently missed detail: chargeable weight calculations that exclude accessorials or duties will understate true per-unit cost, sometimes by a wide margin on international shipments where customs fees alone can rival the linehaul charge. Keep VAT allocation and rebates out of the base cost calculation itself. Recognize them separately, timed to when they’re actually incurred, or your monthly numbers will swing for reasons that have nothing to do with shipping volume.
Freight-In vs. Freight-Out: Why the Accounting Split Matters
The IRS draws a clean line here, and it has real consequences for your income statement. Publication 334 requires inbound freight, the cost of getting inventory from your supplier to your warehouse, to be capitalized into inventory value. That cost sits on your balance sheet until the item sells, at which point it flows into cost of goods sold.
Freight-out works differently. The cost of shipping a finished order to your customer is a selling expense, recognized immediately as an operating cost, not tucked into inventory.
- Freight-in → capitalized into inventory → hits COGS at the point of sale
- Freight-out → expensed immediately → sits in operating expenses, below the gross margin line
The practical test is simple: did this charge bring inventory into your business, or did it send a finished product out to a customer? Misclassify freight-in as an operating expense and your gross margin looks artificially high. Misclassify freight-out as COGS and you understate operating expenses while inflating margin in the wrong direction, distorting exactly the number the role gross profit plays in growth decisions depends on.
Setting Up Allocation Rules in Your ERP or Accounting System
Most mid-market ERPs give you three configuration choices that determine how allocation actually runs: the basis (order, line item, or total shipment), the cost types included (base freight, accessorials, discounts), and how accessorials get treated during invoice matching.
Sage’s landed cost documentation walks through adding prepaid freight to inventory value and allocating it by weight percentage or line-item share, a pattern SAP and JD Edwards implement with their own allocation flows. The harder problem is rarely the software; it’s the data feeding it. You need order IDs, carrier PRO numbers, and a lane mapping table that ties invoices back to shipments.
- Configure the allocation basis before importing a single invoice, not after
- Match invoices to orders using PRO number or order ID as the primary key
- Set fallback logic (carrier, lane, or date range) for invoices that won’t match cleanly
- Run monthly reconciliation between accrued freight and actual invoiced freight
Pro Tip: No ERP integration yet? A monthly Excel bridge using VLOOKUP or a pivot table against your order export can apply lane averages accurately enough to make real decisions, long before you justify the cost of automation.
Where Freight Allocation Breaks Down (and How to Prevent It)
The same three mistakes show up in nearly every audit of a growing brand’s freight accounting, according to guidance on freight and COGS classification. Freight-in and freight-out get mixed into one general ledger account. Accessorial charges get excluded from allocation because they arrive on a separate invoice line. Shipments get logged without a matching order ID, making retroactive allocation impossible.
- Keep freight-in and freight-out in separate GL accounts, always
- Write down your allocation policy so a new hire can apply it the same way you do
- Run a monthly variance check comparing allocated cost against actual invoices by lane
- Retain matching documentation (PRO numbers, invoices, order IDs) for at least the audit window your accountant recommends
Pro Tip: Pick one lane every quarter and audit it line by line against the carrier invoice. It takes an hour and it’s the fastest way to catch a broken allocation rule before your accountant does.
When Allocation Changes the Decision, Not Just the Number
Allocated freight data earns its keep the moment it starts changing decisions instead of just filling a spreadsheet column. Customer-level profitability is the clearest case: once you allocate freight by customer or by order, you often find your biggest customers by revenue aren’t your most profitable ones once shipping is factored in, which opens the door to freight surcharges or order minimums for costly accounts.
- SKU landed cost, inclusive of allocated freight, should drive pricing and SKU rationalization decisions, not just factory cost
- Lane averages give you a benchmark for negotiating with carriers or comparing 3PL cost structures against what you’re currently paying
- A simple weight or revenue-based rule is fine for a business shipping one product line through one channel
- Once you run multiple SKUs, channels, or fulfillment partners, lane-level or direct assignment earns the extra setup time
Commerce Catalyst’s Allocation Checklist for Founders
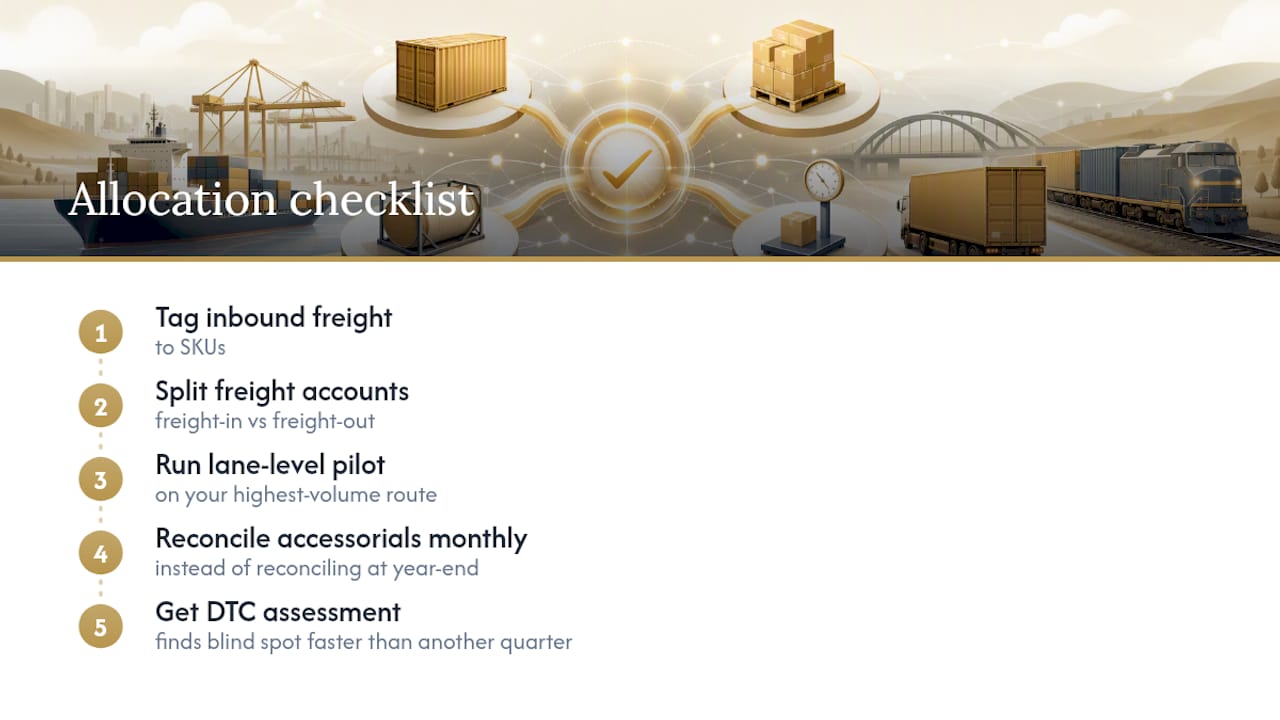
Before your next pricing review, tag inbound freight to SKUs, split your freight-in and freight-out accounts, run a lane-level pilot on your highest-volume route, and reconcile accessorials monthly instead of at year-end. If the numbers still don’t add up, a DTC Financial Health Assessment finds the blind spot faster than another quarter of guessing.
Get Help Turning Freight Data Into Margin Decisions
Building an accurate allocation model in a spreadsheet is one thing. Knowing whether it’s actually changing the right pricing, sourcing, or customer decisions is another. Commerce Catalyst’s DTC Financial Health Assessment exists for exactly that gap: a structured diagnostic that pinpoints where your costing, including freight allocation, is quietly distorting gross margin, without requiring you to hire a full-time finance team.

If your freight numbers point to a bigger structural problem, the 90-Day Profit Sprint is built for founders who need a fast, outcome-focused fix rather than a months-long internal build. And if you’re still deciding whether to solve this internally or bring in outside eyes, Commerce Catalyst’s fractional CFO support can pressure-test your current model before you commit resources either way. Start with the assessment if you’re not yet sure where the leak is.
Sources
For the accounting rules, IRS Publication 334 governs freight-in capitalization. For system configuration, review Oracle’s allocation rule documentation and SAP’s cost distribution guidance.
- Publication 334 (Tax Guide for Small Business): IRS
- Oracle Transportation Management: Allocation Rule Manager
- Freight cost allocation by lane: Nuvocargo
- Freight cost per unit calculator: Pulsify