The most effective consumer brand overhead reduction checklist runs in three tiers: immediate wins you can execute in 0–30 days (SaaS audit, vendor freeze, top-10 supplier review), short-term projects in 31–180 days (contract renegotiations, automation pilots, SKU rationalization), and strategic initiatives in 6–18 months (supply-chain consolidation, lease restructuring, organizational redesign). Before you touch a single line item, identify your brand non-negotiables: the quality standards, service levels, and formulations your customers chose you for. Cutting those first is the fastest path to churn.
Here are the six immediate actions worth starting this week, drawn from standard small-business overhead tactics:
- Run a SaaS and subscription audit: list every recurring charge, flag duplicates and unused seats, and cancel or downgrade within 30 days.
- Freeze all nonessential discretionary spend pending a full P&L review.
- Review your top-10 vendors by spend and request a renewal conversation with each.
- Automate accounts receivable follow-up using tools like Billtrust or HighRadius.
- Assess your office footprint: identify underused space that could be subleased or consolidated.
- Pull your SG&A as a percentage of revenue and compare it to your category benchmark.
Pro Tip: Before any cut, write down your three to five brand non-negotiables: the product attributes, service standards, or customer experience elements that define why buyers choose you. Post them somewhere visible. Every cost decision runs through that filter first.
Key Takeaways
The most durable overhead reductions come from redesigning how your business operates, not from slashing line items: and the brands that protect their non-negotiables throughout the process come out with both better margins and stronger customer relationships.
| Point | Details |
|---|---|
| Start with a baseline | Calculate SG&A as a percentage of revenue for the trailing 12 months before any initiative launches. |
| Three-tier timeline | Sequence actions across 0–30 days (audits, freezes), 31–180 days (pilots, renegotiations), and 6–18 months (structural redesign). |
| Protect brand non-negotiables | Identify quality standards and service levels that define your brand before cutting anything; run consumer tests before any formulation change. |
| Measure run-rate, not one-time | Track annualized run-rate savings separately from one-time events; only run-rate savings improve your ongoing cost structure. |
| Commerce Catalyst | The DTC Financial Health Assessment provides a prioritized overhead reduction plan benchmarked against your category. |
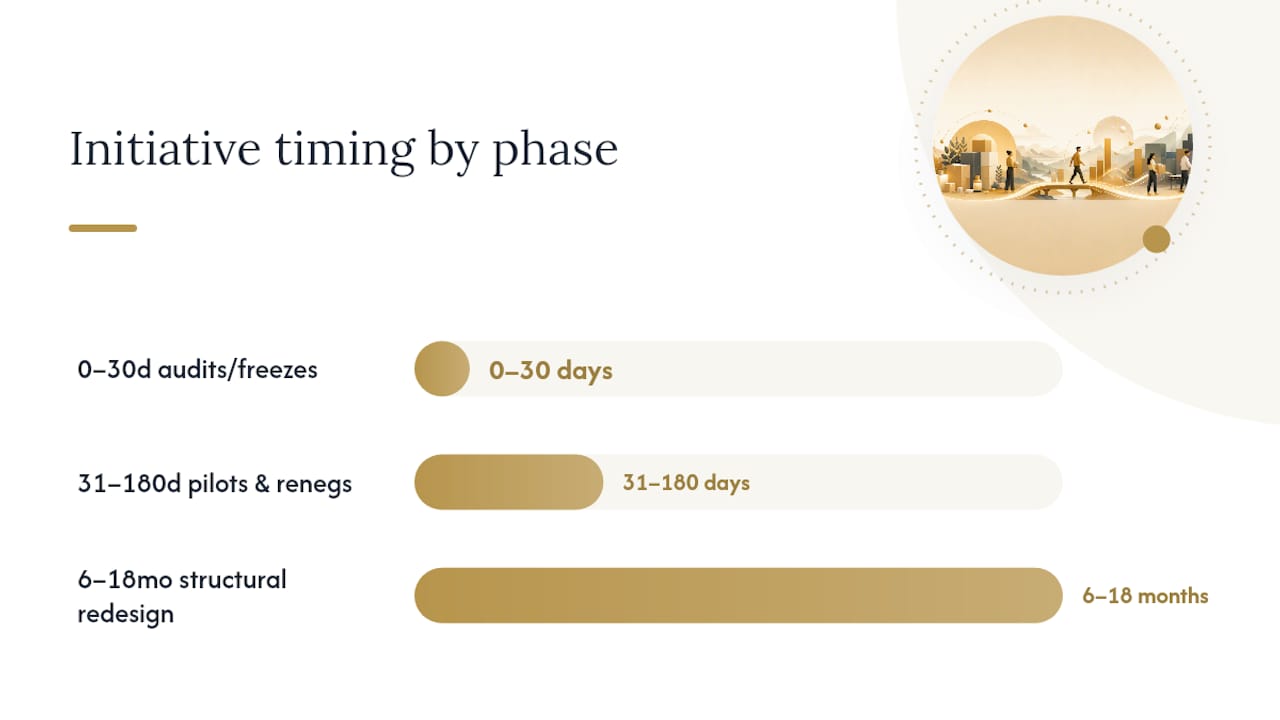
Table of Contents
- What counts as overhead for a consumer brand?
- Your prioritized overhead reduction checklist by timeline
- How do you measure and track overhead savings?
- What should you never cut? Red flags and brand-preserving rules
- How to pilot overhead reductions without service failures
- What do the benchmarks look like for your category?
- How do you get your team aligned on cost reduction?
- Legal and compliance considerations in cost-cutting
- Which technology investments actually reduce overhead sustainably?
- How do you manage risk during an overhead reduction program?
- The cuts that look smart and aren’t
- How Commerce Catalyst supports your overhead reduction program
- Sources
What counts as overhead for a consumer brand?
Overhead is any operating cost that does not vary directly with each unit you produce or sell. The practical industry term is SG&A (selling, general, and administrative expenses), which sits below gross profit on your P&L and is distinct from COGS (cost of goods sold). Getting this boundary right matters because a cut that looks like overhead reduction can quietly shift cost into COGS or degrade product quality if it is misclassified.
Fixed overhead stays constant regardless of volume. For a consumer brand, that means office rent, base salaries, software licenses, insurance, and minimum 3PL storage fees. These costs do not flex month to month, so reducing them requires a structural change: a lease renegotiation, a headcount redesign, or a contract cancellation.

Variable overhead scales with activity but is not a direct input to the product. Outbound freight on returns, customer support tickets, and performance marketing agency fees all move with volume without being embedded in unit cost. You can reduce these by improving operational efficiency: better packaging reduces damage rates, better onboarding reduces support tickets.

Semi-variable overhead has a fixed base and a variable component. Utilities, warehouse labor, and some SaaS platforms (seat-based pricing) fall here. The fixed base is the floor you negotiate; the variable component is where process improvements pay off.
The SG&A versus COGS boundary trips up founders most often in two places. First, packaging: the physical box or pouch is COGS, but the design agency retainer and the structural engineering work are SG&A. Cutting the design retainer saves overhead; substituting a cheaper substrate changes your product. Second, customer support: the team handling post-purchase questions is SG&A overhead, but if you cut it to the point that returns spike or reviews fall, the downstream cost lands in COGS-adjacent metrics like return rate and reorder rate.
Use this list when scanning your P&L to separate fixed and variable brand costs:
- Fixed SG&A: rent, base salaries, insurance, core software licenses, minimum storage fees
- Variable SG&A: performance marketing, agency retainers, freight on returns, variable customer support labor
- Semi-variable SG&A: utilities, seat-based SaaS, warehouse labor above a base crew
- COGS (not overhead): raw materials, packaging substrates, contract manufacturing fees, inbound freight, direct labor on production
- Watch the boundary: formulation changes, ingredient substitutions, and packaging substrate swaps are product decisions, not overhead cuts: treat them accordingly
Your prioritized overhead reduction checklist by timeline
Immediate actions (0–30 days)
These are low-effort, high-signal moves. None of them require a contract change or a capital commitment. Their primary value is establishing a baseline and stopping the bleed on obvious waste.
- SaaS and subscription audit: Owner: Finance or Ops. Effort: Low. Pull every recurring charge from your bank statements and credit cards. Flag tools with fewer than 50% of seats active. Expected savings: a moderate portion of your current software spend. Red flag: do not cancel tools your 3PL or co-manufacturer relies on for EDI or order routing without a replacement in place.
- Vendor top-10 review: Owner: Founder or COO. Effort: Low. Rank vendors by annual spend. For the top 10, confirm whether you are on a current contract or month-to-month. Month-to-month relationships are immediate renegotiation opportunities. Benchmarking your software spend per employee before those conversations can unlock 15–20% discounts at renewal.
- Discretionary spend freeze: Owner: Finance. Effort: Low. Pause all nonessential spend above a threshold (typically $500–$1,000 per transaction) pending P&L review. This is a 30-day hold, not a permanent cut.
- AR automation pilot scoping: Owner: Finance. Effort: Low. Identify your top-20 overdue accounts and the manual steps your team runs to follow up. Scope a pilot using a tool like Billtrust, Versapay, or a native ERP module. One case study documented a 74% reduction in AR operating costs after end-to-end automation, with staff redeployed rather than cut.
- Office footprint assessment: Owner: COO or Ops. Effort: Low. Map square footage against actual utilization. If you are using less than 70% of your space, flag it for sublease or lease renegotiation in the next cycle.
- SG&A % baseline: Owner: Finance. Effort: Low. Calculate SG&A as a percentage of net revenue for the trailing 12 months. This is your starting benchmark for every initiative that follows.
Short-term projects (31–180 days)
| Action | Owner | Effort | Est. Savings | Brand Red Flag |
|---|---|---|---|---|
| Renegotiate top-5 vendor contracts | COO / Founder | Medium | 8–15% of contract value | Do not accept lower service-level minimums without a written rollback clause |
| AR automation pilot (live) | Finance | Medium | 20% of AR labor cost | Confirm customer communication tone matches brand voice |
| Packaging improvement test | Product / Ops | Medium | 3–8% of packaging COGS | No substrate change without consumer panel or A/B test |
| SKU rationalization pilot | Product / Finance | High | 5–12% of inventory carrying cost | Protect top-20% SKUs by revenue and margin; do not exit without sell-through plan |
| Hybrid/remote work policy | HR / Ops | Low | 10–20% of office overhead | Maintain in-person cadence for product development and QA teams |
| Admin automation (AP, reporting) | Finance / Tech | Medium | 15% of admin labor cost | Audit outputs weekly for the first 60 days |
Strategic initiatives (6–18 months)
These require cross-functional alignment, longer lead times, and careful sequencing. Rushing them produces the service failures and brand erosion that cost more to fix than the savings were worth.
The CPG cost-takeout sprint playbook recommends a 12-week sprint structure with SKU keep/fix/migrate/exit rules and explicit plant guardrails to protect throughput. Apply the same logic here: define what you will not touch before you define what you will.
- Supply-chain consolidation: Reduce co-manufacturer or supplier count where you have redundant relationships. Target: 10–20% reduction in procurement overhead. Guardrail: maintain at least one backup supplier for your top-3 SKUs.
- Lease renegotiation or downsizing: Engage your landlord 9–12 months before lease expiration. Hybrid work data strengthens your negotiating position. Guardrail: do not exit a location that houses QA or production oversight without a transition plan.
- Organizational redesign: Reassign roles before cutting headcount. Identify functions that automation has partially replaced and redirect those hours to revenue-generating activity. Guardrail: never reduce QA, food safety, or regulatory compliance staff below the minimum required for your category.
- Decision simulation for reformulations: Before any ingredient or formulation change, model segment-level consumer responses using a tool like Lexsis AI’s decision simulation. The cost of a failed reformulation: in switching, returns, and retailer chargebacks: typically exceeds the savings by a wide margin.
How do you measure and track overhead savings?
The overhead rate formula is clear: divide total overhead costs by a base (usually net revenue or direct labor hours) and express it as a percentage. SG&A as a percentage of revenue is the most common version for consumer brands.
Sample calculation:
- Trailing 12-month net revenue: $12,000,000
- Trailing 12-month SG&A: $3,600,000
- SG&A % of revenue: 30%
After a 90-day initiative that eliminates $180,000 in annualized SaaS and vendor costs:
- New annualized SG&A: $3,420,000
- New SG&A %: 28.5%
- Run-rate savings: $180,000 per year
The distinction between run-rate savings and one-time savings matters enormously for investor conversations and for your own planning. A one-time savings event (selling excess inventory, subletting unused space for a single quarter) does not improve your ongoing cost structure. Run-rate savings: a cancelled contract, a renegotiated lease, an automated workflow: recur every period and compound.
Track these metrics monthly: overhead rate, SG&A % of revenue, run-rate savings versus baseline, and payback period on any automation investment. Payback period is simply the upfront cost divided by the monthly run-rate saving. An AR automation tool that costs $24,000 to implement and saves $5,000 per month pays back in under five months.
For savings to survive investor diligence, you need documentary evidence: signed amended contracts, before-and-after invoice records, and operational metrics (fill rate, order-to-cash cycle time, support ticket volume) that confirm the change did not degrade service. Savings that appear on a spreadsheet but cannot be traced to a contract or a process change will be discounted or disallowed in a quality-of-earnings review.
What should you never cut? Red flags and brand-preserving rules
The single biggest trap in overhead reduction is treating SG&A as a cost pool to slash rather than a set of functions to redesign. Blind cuts produce hidden costs: service failures, churn, and retailer chargebacks that arrive 60–90 days after the cut and are far harder to reverse than the savings were to capture.
NielsenIQ’s analysis of ingredient and quality changes found that brand changes tied to ingredient or quality shifts drive high rates of consumer switching. The mechanism is clear: your customer bought a specific product experience. Change it without telling them, and you have broken an implicit contract. The cost of reacquiring a switched customer is almost always higher than the cost of the ingredient you saved.
Clear red flags: stop before you act on any of these without a formal test and rollback plan:
- Ingredient or formulation substitutions without a blinded consumer panel or A/B test
- Cutting QA staff or QA frequency below the minimum required by your category’s regulatory framework
- Unilateral service-level reductions (slower shipping, reduced support hours) without customer communication and a compensation mechanism
- Price promotions used as a cover for cost-cutting: they reset value perception and are extremely difficult to walk back
- Reducing packaging quality in ways that increase damage rates or change the unboxing experience your brand is known for
Repeated small compromises accumulate into brand erosion that is far more expensive to reverse than the original savings. The shortcut trap is real: each individual decision looks defensible in isolation, but the cumulative effect depletes the brand equity you spent years building.
Pro Tip: When a necessary change is unavoidable: a supplier discontinues an ingredient, a cost increase forces a reformulation: communicate it proactively to your top retail partners and your most loyal customers before it ships. Frame it as a product improvement wherever honest. Silence is what creates the trust gap.
How to pilot overhead reductions without service failures
Pilots exist to generate evidence before you commit. A pilot that fails is not a failure: it is a $20,000 lesson that saved you from a $200,000 mistake. The discipline is in defining success and rollback criteria before you start, not after the results come in.
A practical pilot framework for any overhead reduction initiative:
- Define scope: one vendor, one workflow, one SKU cluster, one location. Never pilot across the entire business simultaneously.
- Assign a single owner: one person is accountable for the pilot outcome. Committees make decisions; owners make things happen.
- Set a timeframe: 30, 60, or 90 days depending on the initiative. Longer pilots lose momentum; shorter ones lack statistical signal.
- Establish success metrics upfront: cost savings achieved, service-level metrics maintained (fill rate, order-to-cash, support response time), and no increase in defect or return rate.
- Define rollback criteria: if fill rate drops below X%, if customer complaints increase by Y%, or if the automation produces Z% error rate, you stop and revert.
- Run weekly guardrail checks: a 15-minute weekly review of the pilot metrics against the rollback criteria. The CPG sprint playbook uses this cadence to catch problems before they compound.
- Document and scale: if the pilot clears all guardrails, document the process change and roll it out systematically.
For stakeholder alignment, the communication cadence matters as much as the framework. Finance needs to see the savings model before the pilot starts. Operations needs to understand the rollback criteria. Marketing and customer service need to know what changes are being tested so they can flag early customer signals. Product teams need to be in the room for any packaging or formulation pilot: their instinct for brand risk is often sharper than the cost model suggests.
A 12-week sprint structure works well for short-term initiatives: weeks 1–2 for scoping and baseline measurement, weeks 3–8 for the live pilot with weekly guardrail checks, and weeks 9–12 for analysis, documentation, and scale decision. Pause the sprint if a guardrail is triggered. Resuming after a pause is far less costly than reversing a scaled rollout.

What do the benchmarks look like for your category?
Benchmarks give you a reference point, not a mandate. Your internal trend: whether SG&A % is moving in the right direction over time: is usually more meaningful than a cross-company comparison, because business models, channel mix, and growth stage all affect the numbers. That said, knowing where your category typically lands helps you identify whether you have a structural problem or a temporary one.
| Category | SG&A % of Revenue (Typical Range) | Overhead Rate Target | Notes |
|---|---|---|---|
| Fashion / Apparel | 28.5% | 30% of net revenue | Higher in DTC-heavy models due to ad spend and returns |
| Food & Beverage | 20–30% | 18–28% of net revenue | Lower gross margins compress SG&A headroom |
| Pet Care | 30% | 20–30% of net revenue | Regulatory and QA costs add fixed overhead floor |
| DTC Blended | 30% | 28.5% of net revenue | Fulfillment and customer acquisition inflate variable SG&A |
For fashion and apparel brand benchmarks and pet care brand benchmarks, category-specific KPI ranges are available to help you calibrate your targets. Software spend per employee is a useful secondary metric: if your team is spending significantly above the market rate per head, you likely have shadow IT or redundant tools that a SaaS audit will surface.
The limit of benchmarks is that they describe the average, not the optimal. A brand with a differentiated supply chain or a proprietary manufacturing process may run higher overhead rates and still outperform peers on margin because its COGS are structurally lower. Use benchmarks to ask the right questions, not to set arbitrary targets.
How do you get your team aligned on cost reduction?
Cost reduction initiatives fail more often from organizational resistance than from bad tactics. When employees hear “overhead reduction,” they hear “layoffs”: and that fear produces exactly the behavior you cannot afford: hoarding information, sandbagging estimates, and protecting turf rather than finding savings.
The antidote is transparency about what you are doing and why, combined with a clear signal that the goal is to make the business more durable, not to eliminate roles. Framing matters: you are redesigning how the business operates, not dismantling it.
Practical alignment steps that work in practice:
- Share the SG&A baseline and the target range with your leadership team before any initiative launches. People support what they understand.
- Involve department heads in identifying savings within their own functions. They know where the waste is; they just need permission and a framework to surface it.
- Tie savings to a visible reinvestment: if the AR automation frees up $60,000 per year, name where that goes (a new product launch, a marketing test, a sales hire). Savings that disappear into the P&L without a visible payoff feel like extraction.
- Protect roles through reassignment where possible. Redeploying staff rather than cutting them after automation is both more humane and more strategically sound: institutional knowledge is expensive to rebuild.
- Run a brief all-hands update at the end of each sprint phase. Acknowledge what worked, what did not, and what comes next. Silence breeds speculation.
Legal and compliance considerations in cost-cutting
Cost-cutting decisions that touch regulated functions carry legal exposure that is easy to underestimate when you are focused on the savings number. The most common risk areas for consumer brands in the United States are employment law, food and product safety, and contract obligations.
On the employment side, any reduction in force must comply with the Worker Adjustment and Retraining Notification (WARN) Act if you have 100 or more employees and are laying off 50 or more within a 30-day period. Even below that threshold, state-level mini-WARN laws in California, New York, and New Jersey impose notice requirements at lower headcount thresholds. Consult employment counsel before any headcount reduction, not after.
Product safety and regulatory compliance are non-negotiable floors. For F&B brands, FDA regulations govern labeling, ingredient declarations, and facility registration. For pet care, AAFCO guidelines and state feed laws set minimum standards. Cutting QA staff or reducing testing frequency below the levels required by your category’s regulatory framework is not an overhead reduction: it is a liability.
Contract obligations are the most commonly overlooked constraint. Before you renegotiate or exit a vendor agreement, review the termination clauses, minimum purchase commitments, and exclusivity provisions. Exiting a contract early without cause can trigger penalties that exceed the savings you were targeting. The same applies to lease agreements: early termination fees and restoration obligations can make a seemingly attractive exit far more expensive than staying.
Finally, if your brand sells through retail partners, review your trading agreements before making any changes to product formulation, packaging, or service levels. Many retailer agreements include quality-consistency clauses that give the retailer recourse: including delistings or chargebacks: if you change a product without prior notification.
Which technology investments actually reduce overhead sustainably?
Technology reduces overhead when it replaces a manual process that scales linearly with volume. It adds overhead when it requires ongoing customization, dedicated support staff, or frequent vendor management that consumes more time than the process it replaced.
The highest-return technology investments for consumer brands at the $5M–$75M revenue range tend to cluster in four areas. Accounts receivable and accounts payable automation: tools like Billtrust, Versapay, or Tipalti: replace manual invoice processing and follow-up with rule-based workflows that run without human intervention. The operational cost reduction can be substantial, as documented in AR automation case studies. ERP consolidation is the second high-return area: brands running separate systems for inventory, finance, and order management on platforms like NetSuite or Cin7 often find that consolidating onto a single platform eliminates the integration overhead and the manual reconciliation work that sits between disconnected systems.
Third-party logistics (3PL) technology integrations: specifically, real-time inventory visibility and automated replenishment triggers: reduce the labor cost of inventory management and the carrying cost of safety stock held against forecast uncertainty. The fourth area is customer support automation through tools like Gorgias or Zendesk with AI-assisted routing, which can handle a significant share of post-purchase inquiries without adding headcount as order volume grows.
The discipline is in the selection criteria. Before committing to any technology investment, confirm three things: the tool integrates with your existing stack without custom development, the implementation timeline is under 90 days, and the payback period is under 12 months based on conservative assumptions. Technology that takes 18 months to implement and requires a dedicated administrator to maintain has a habit of adding overhead rather than reducing it.
How do you manage risk during an overhead reduction program?
Every overhead reduction initiative carries the risk that the savings are real but the costs they create are invisible: at least for the first 60–90 days. Service failures, supplier quality problems, and customer experience degradation tend to show up in lagging metrics: return rates, churn, retailer chargebacks, and review scores. By the time those signals are visible, the damage is already done.
The practical risk management framework has three components. First, define your operational floor before you start. What fill rate, order-to-cash cycle time, and customer satisfaction score are you unwilling to fall below? These are your guardrails, and they are non-negotiable regardless of the savings opportunity. Second, build a rollback plan for every initiative before it launches. A rollback plan is not a sign of pessimism: it is the thing that lets you move fast without catastrophic downside. Third, maintain a contingency reserve.
Scenario planning is worth the time investment for any initiative with a savings target above $100,000. If the third scenario is survivable, proceed. If it is not, either reduce the scope of the initiative or build a larger contingency before you start.
The operational efficiency and brand growth relationship is not a zero-sum trade. Done well, overhead reduction frees capital for the investments that actually drive revenue: product development, marketing, and distribution. Done poorly, it consumes management attention, damages customer relationships, and produces savings that evaporate in the cost of recovery.
The cuts that look smart and aren’t
The overhead reduction decisions that cause the most damage are rarely the obvious ones. Nobody cuts their best-selling SKU or fires their top sales rep and calls it a cost-saving measure. The dangerous cuts are the ones that look defensible on a spreadsheet and feel like discipline in the moment.
The brands that run lean without running hollow share a common discipline: they treat their cost structure the way a good editor treats a manuscript. They cut what does not serve the reader: the redundant processes, the legacy tools, the meetings that produce no decisions: and they protect what does. The test is not “can we afford to keep this?” It is “what happens to the customer experience if we remove it?”
Overhead reduction is not a one-time project. It is a recurring practice, like a monthly P&L review or a quarterly vendor audit. The brands that build it into their operating rhythm compound small savings into material margin improvement over time. The brands that treat it as a crisis response cut too deep, too fast, and spend the next year rebuilding what they dismantled.
How Commerce Catalyst supports your overhead reduction program
Running a disciplined overhead reduction program requires a clear baseline, a prioritized action plan, and someone who has seen enough brand P&Ls to know which cuts are safe and which ones will cost you twice what you saved.

Commerce Catalyst’s DTC Financial Health Assessment maps your current cost structure against category benchmarks, identifies the strongest reduction opportunities, and gives you a prioritized action plan you can execute in the next 90 days. For founders who want guided implementation, the 90-Day Profit Sprint runs the full checklist with you: scoping pilots, setting guardrails, and tracking run-rate savings through to a documented result. Both engagements are grounded in the same framework described in this article: action-first, brand-preserving, and built for consumer brands operating between $5M and $75M in revenue. If you are ready to see where your overhead stands against your category, the Financial Health Assessment is the right starting point.
Sources
- When ingredient changes reshape brand perception and trust
- Software spend per employee benchmark
- 10 Smart and Practical Ways to Cut Your Overhead Costs
- Overhead Costs: What They Are, How to Calculate and Reduce Them
- How AI Automation Cut Accounts Receivable Costs 74%: With Zero Layoffs - Simpatico Systems
This article is general information, not a substitute for advice from a qualified financial advisor. Consult a qualified financial professional about your own circumstances before acting on anything here.