CAC payback period equals your customer acquisition cost divided by monthly gross profit per customer, and it tells you how many months it takes to earn back what you spent to win that customer. Most healthy startups target under 12 months, with high-performing self-serve SaaS companies landing at 5 to 7 months. The number changes fast depending on which channel and margin assumptions you plug in, so a single company-wide average can hide serious problems underneath it.
TL;DR:
- The optimal CAC payback period should be under 12 months, with high-performing SaaS teams achieving 5 to 7 months, but longer cycles are acceptable if justified by retention.
- Accurate calculation depends on fully loaded CAC, including sales salaries and marketing costs, divided by gross profit, not revenue, to reflect true cash recovery time.
- Comparing payback across channels and cohorts reveals underlying inefficiencies, such as underperforming channels or onboarding delays, that blended averages can mask.
- Shortening payback often involves improving onboarding speed, shifting to lower CAC channels, and boosting gross margin rather than simply reducing marketing spend.
- A payback period approaching 15 months signals the need for diagnostic review and operational fixes to avoid reliance on investor tolerance or risking cash flow issues.
Table of Contents
- What CAC Payback Period Actually Measures
- The CAC Payback Formula and Its Inputs
- A Worked Example You Can Copy Into a Spreadsheet
- What Counts as a Good CAC Payback Period
- The Fastest Ways to Shorten Payback
- Why Payback Period Drives Runway and Fundraising Conversations
- What Commerce Catalyst Sees in Founder Diagnostics
- Get a Diagnostic Before You Guess at Fixes
- Sources
- FAQ
What CAC Payback Period Actually Measures
CAC payback period isn’t a revenue question. It’s a cash question. The formula only works if you divide acquisition cost by gross profit, not gross revenue, because revenue you haven’t actually kept doesn’t help you recover anything. Forecastr’s breakdown of the metric makes this distinction the whole point: use top-line revenue and you’ll underestimate how long a customer actually takes to become profitable.
Gross margin is where the real cost of serving a customer lives. Hosting fees, customer support, onboarding specialists, payment processing. All of it eats into the profit you’re using to pay back that acquisition spend, and skipping it flatters your numbers in a way that eventually catches up with your cash position.
You also have to decide the scope. Company-wide payback is useful for board reporting, but it smooths over channel-level and cohort-level differences that actually drive decisions.
Common mistakes worth avoiding:
- Using gross revenue instead of gross profit in the denominator
- Blending all channels into one number and missing a channel that’s quietly underwater
- Excluding onboarding or support costs from the margin calculation
- Comparing your payback period to companies with a fundamentally different sales motion
The CAC Payback Formula and Its Inputs
The formula itself is simple: CAC payback period (months) = CAC ÷ (ARPA × gross margin %). Getting a trustworthy number out of it depends entirely on how carefully you define each input, a point Corporate Finance Institute walks through in its own calculation guide.
- Calculate fully loaded CAC. Include sales salaries and commissions, ad spend, marketing tooling, and any agency fees tied to acquisition. A number that only counts ad spend isn’t fully loaded, and it will make payback look faster than it is.
- Convert revenue to a monthly figure. Use ARPA (average revenue per account) or new MRR from the cohort you’re measuring. If you bill annually, divide by 12 to get a comparable monthly number.
- Calculate gross margin as a percentage. Subtract cost of goods sold and cost of service, including hosting, support, and payment processing, from revenue.
- Multiply monthly ARPA by gross margin percentage. This gives you monthly gross profit per customer, the true “payback” amount.
- Divide CAC by that monthly gross profit figure. The result is months to recover the acquisition cost.
Keep your definitions consistent across periods and channels. A CAC payback period calculated with three different margin assumptions in three different quarters tells you nothing you can act on.
A Worked Example You Can Copy Into a Spreadsheet
Say your SaaS company spends $1,200 in fully loaded CAC per customer. Monthly gross profit per customer is $150 × 0.80 = $120. Divide $1,200 by $120, and payback lands at 10 months.
Now compare channels. Paid social might carry a CAC of $1,800 against the same $120 monthly gross profit, a 15-month payback. Organic and referral customers, acquired for $600, pay back in 5 months. Averaged together, the blended payback looks like a reasonable 10 months, but that average is masking a paid channel that’s bleeding cash for over a year before it turns profitable, a distortion Wall Street Prep’s calculator guidance specifically warns against.

Build your own version with four cells: CAC, ARPA, gross margin percentage, and months to recover. Make CAC and ARPA toggleable by channel so you can run the same formula against paid, organic, and referral separately.
Pro Tip: Run the calculation by cohort, not just by channel. A cohort acquired during a discount promotion often shows great CAC but terrible payback once the discount expires and true ARPA kicks in.
What Counts as a Good CAC Payback Period
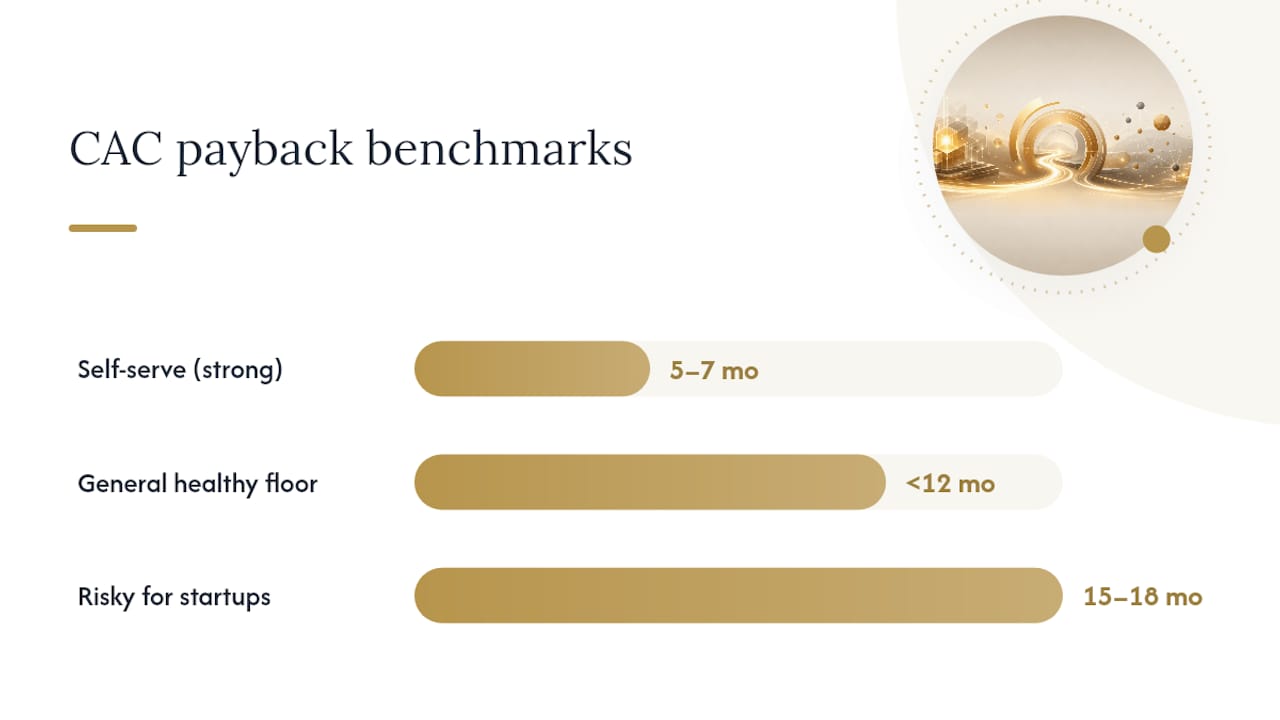
Context decides what “good” means here more than any universal number does. Geckoboard’s KPI benchmarks put the general health threshold at under 12 months, with high-performing product-led growth and self-serve SaaS companies often hitting 5 to 7 months because their onboarding is faster and their sales cost per customer is lower.
Enterprise motions run longer almost by design. Longer sales cycles and higher-touch onboarding push payback out, sometimes well past 12 months, and that’s not automatically a red flag if contract values and retention justify it.
Startups without deep-pocketed investor patience should aim to recover CAC within a year. Companies coasting on 15 to 18 month paybacks are relying on investor tolerance that doesn’t last forever, according to Geckoboard’s analysis.
A few rules worth internalizing:
- Compare yourself to companies with a similar sales motion and deal size, not the broader market
- Watch the trend across quarters more closely than any single snapshot
- Treat payback under 12 months as the general floor, and under 7 months as a strong signal for self-serve models
The Fastest Ways to Shorten Payback
Shortening payback rarely means spending less on marketing across the board. It usually means being smarter about where that spend goes and how quickly a new customer gets to value. Forecastr’s research on this points to onboarding and expansion as often producing faster wins than pricing changes because they touch existing customers rather than requiring new acquisition spend at all.
The levers, roughly in order of effort required:
- Shift channel mix toward lower CAC sources like referral and organic before cutting paid spend entirely
- Speed up onboarding so customers reach their first value moment faster, which reduces early churn and protects ARPA
- Improve gross margin by renegotiating hosting or support costs that eat into monthly profit
- Adjust pricing and packaging to raise ARPA, a structural change worth testing carefully before rolling out
- Prioritize expansion and upsell among existing customers, since incremental revenue here carries close to zero incremental CAC
Retention work compounds these gains. Reducing early churn effectively raises the lifetime ARPA you’re dividing against, and proven retention tactics tend to move payback faster than most acquisition tweaks.
Pro Tip: Start with reallocating ad budget toward your best-performing channel and tightening one onboarding step. Both are reversible if they don’t work, unlike a pricing change you have to walk back publicly.
Why Payback Period Drives Runway and Fundraising Conversations
Every dollar tied up in unrecovered CAC is a dollar you can’t redeploy, which means a longer payback period directly increases how much growth capital you need to keep scaling. A company recovering CAC in 6 months can reinvest that cash into new acquisition twice as often as one waiting 12 months for the same dollar to come back.
Boards and investors read payback as a trend line, not a single quarter’s result. A payback period creeping from 8 months to 14 months over three quarters raises far more concern than one noisy month tied to a big campaign push, particularly against the 15 to 18 month range Geckoboard flags as a warning zone without investor patience to match.
Longer payback can still be defensible if net revenue retention is strong enough to make the long-term math work. Package that argument with LTV to CAC ratio data, not payback numbers alone.
What Commerce Catalyst Sees in Founder Diagnostics
Founders often assume their payback problem is a pricing problem. It rarely is. Channel and onboarding issues surface first in many diagnostics before any conversation about raising prices makes sense.
A common approach starts with breaking blended CAC apart by channel, then examining how fast new customers reach their first value moment. That combination can uncover patterns like one channel quietly dragging the average down, and an onboarding gap costing more in early churn than acquisition inefficiencies. Fixing those two things first, before touching pricing or packaging, tends to shorten payback and help clarify priorities for next quarter.
Get a Diagnostic Before You Guess at Fixes
Some financial advisory services give founders something a spreadsheet formula can’t: a prioritized read on which lever actually moves your payback period fastest, based on how your business is really structured, not a generic benchmark.

The DTC Financial Health Assessment breaks your CAC payback down by channel and cohort, flags where gross margin is quietly eating your recovery timeline, and hands you benchmarks against businesses with a similar growth motion. From there, the DTC Operator Diagnostic goes deeper into operational constraints, surfacing quick-win experiments in onboarding, pricing, and channel mix that you can test this quarter without a structural overhaul. Founders typically walk away with a short list of the two or three fixes worth doing first, instead of a dozen ideas with no order of operations. If your payback period has been creeping up for a few quarters and you’re not sure why, start with the financial assessment and get a straight answer before your next board conversation.
Sources
- CAC payback period: what it is, how to calculate it, and what counts as “good”
- CAC payback period | KPI examples | Geckoboard
- CAC Payback Period | Corporate Finance Institute
- CAC Payback Period | Formula + Calculator
FAQ
What Is Considered a Good CAC Payback Period?
Under 12 months is the general health threshold, while high-performing self-serve SaaS companies often achieve 5 to 7 months. Enterprise motions with longer sales cycles frequently run past 12 months without it signaling a problem, as long as retention supports it.
How Do You Calculate CAC?
Add up every fully loaded acquisition cost, including sales salaries, commissions, ad spend, and marketing tools, then divide by the number of new customers acquired in that period. Leaving out sales compensation or tooling costs understates your true CAC.
How Do You Calculate the CAC Payback Period?
Divide CAC by monthly gross profit per customer, which is monthly ARPA multiplied by gross margin percentage. The result, expressed in months, is your CAC payback period.
Is a 15 to 18 Month Payback Period a Problem?
It’s a warning sign for most startups, since that range assumes a level of investor patience that doesn’t hold indefinitely. Companies without deep capital reserves should treat anything approaching 15 to 18 months as a signal to fix channel mix, pricing, or onboarding before it stretches further.
Is CAC Payback the Same as LTV to CAC Ratio?
No. Payback measures how fast you recover acquisition cost in months, while LTV to CAC ratio measures total lifetime economic return on that same acquisition spend. A company can have fast payback and still show a poor LTV to CAC ratio if churn is high.